
 Worksheets
Demand and Supply Finale
Total questions: 62
Worksheet time: 47mins

Graph 5: Price will? and Quantity will? based on this information.
Price will decrease and quantity is indeterminant
Price will increase and quantity is indeterminant
Price is indeterminant and quantity will decrease
Price is indeterminant and quantity will increase

Graph 6: Price will? and Quantity will?
Price will increase and quantity decrease
Price will decrease and quantity decrease
Price will increase and quantity increase
Price is indeterminate and quantity decrease
Price is indeterminate and quantity increase

Graph 7: Price will? Quantity will?
Price will increase and quantity will decrease
Price will decrease and quantity will increase
Price will increase and quantity is indeterminate
Price will decrease and quantity is indeterminate

Graph 8: Price will ? Quantity will?
Price is indeterminate and quantity will increase
Price will increase and quantity will decrease
Price will decrease and quantity will increase
Price will increase and quantity is indeterminate

Graph 1: Price will? Quantity will?
Price will increase and quantity will increase
Price will decrease and quantity will increase

Graph 2: Price will ? Quantity will?
Price will increase and quantity will decrease
Price will decrease and quantity will increase

Graph 3: Price will ? Quantity will ?
Price will increase and quantity will increase
Price will decrease and quantity will increase
Price will decrease and quantity will decrease

Graph 4: Price will ? Quantity will ?
Price will decrease and quantity will decrease.
Price will increase and quantity will decrease.
Price will decrease and quantity will increase.
Price will increase and quantity will increase.
When the price of something increases, the quantity demanded ___?
decreases
reverses
increases
remains the same
Which of the following would cause the demand curve to
shift to the left?
the average annual income increases
government corporate taxes increase
consumers begin to like the product
price of a complementary good increases
What would not cause a change (shift) in the demand curve?
a decrease in the salary’s of the population
a change in popularity of the good
a change in price of the good
an increase in the price of a substitute good
How can expectations about a future price change consumer behavior?
If the price is expected to stay the same, immediate demand will decrease.
Immediate demand for a good is not related to future price expectations.
If a good is expected to be plentiful, demand will not be affected.
Immediate demand will increase, if a good’s price is expected to rise in the future.
SSEMI 3 a: Related goods, income, and preferences are variables MOST LIKELY to affect which part of a market?
supply
demand
quantity supplied
quantity demand
SSEMI 2 a: If the price of a product increases, which is true regarding the demand curve?
demand increases
demand decreases
quantity demanded increases
quantity demanded decreases
SSEMI 2 a: Which statement describes the law of demand?
As prices rise, quantity demanded decreases.
As prices rise, demand decreases.
As prices fall, quantity demanded decreases.
As prices fall, demand decreases.
SSEMI2 a: Which explains why a supply line is upward sloping?
the Law of Supply states there is a direct relationship between price and quantity
the Law of Demand states there is an indirect relationship between price and quantity
the Law of Supply compares marginal costs and marginal benefits in a constant rate
the Law of Demand shows a positive relationship between two goods, creating the slope
A decrease in demand causes what kind of shift?
A shift down
A shift to the left
A shift up
A shift to the right
An increase in demand causes what kind of shift?
A shift to the right
A shift down
A shift to the left
A shift up

Supply is
how much consumers are willing to buy.
how much a producer (a business) is able and willing to make for sale to consumers.
the goods that are left over after a sale.
All of the above
Mr. Sherman goes to the ticket booth to buy tickets for a Lakers game. Mr. Sherman is told that the game is sold out and no tickets are available. Which best explains why there are no basketball tickets available?

Graph shows which of the following?
(actually use this graph to answer the question)
a decrease in demand (shift) and a decrease in quantity supplied
a decrease in demand (shift) and a decrease in supply
a decrease in quantity demanded and a decrease in quantity supplied
a decrease in quantity demanded and a decrease in supply (shift)

Assume the image is showing the market for apples. Which of the headlines could indicate the pictured shift is occurring in the market?
Pesticides on apples linked to mouth cancer.
Storms destroy apple orchards.
An apple a day really does keep the doctor away.
New genetic strain leads to apple trees that produce twice as many apples.

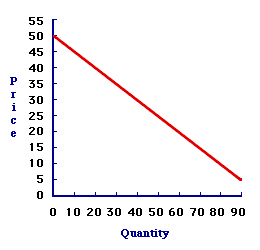
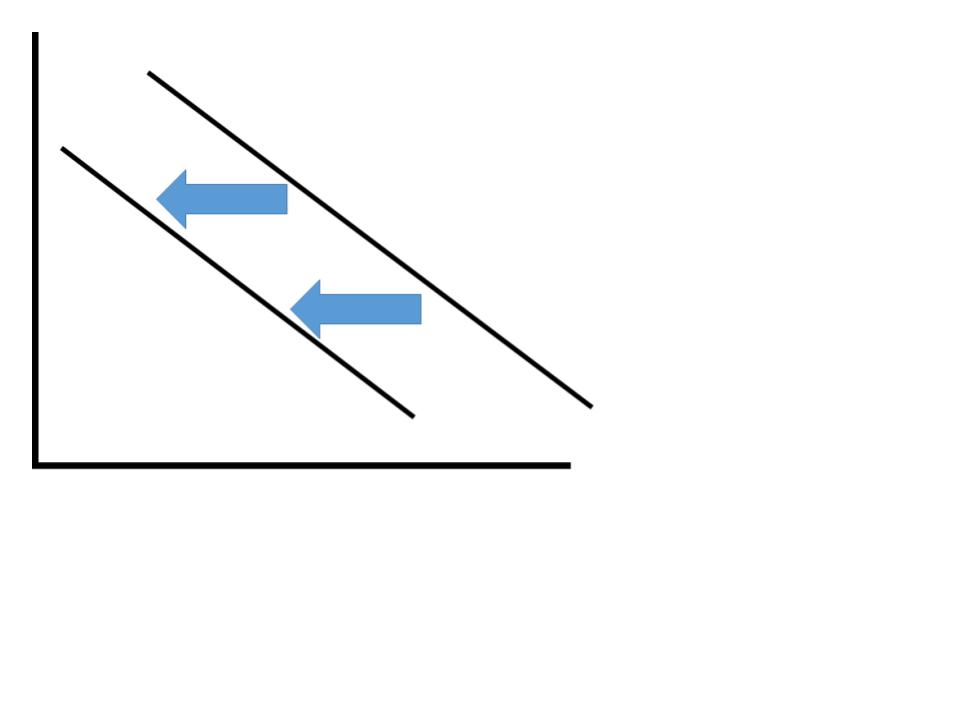
What does the movement shown on this graph represent?
A change in demand
Inverse
The inverse relationship between price and quantity demanded
Diminishing marginal utility

What does the movement from b' to b on the graph represent?
An increase in demand
An increase in QD
A decrease in demand
A decrease in the QD

Study the illustration. At a price of $25, how much more of the product is demanded on curve D'D' than on curve DD?
2 units
3 units
1 unit
4 units

Assume that Damien and Kara are the only two people in the market for mystery novels. Based on the graphs, what would be the market quantity demanded for mystery novels at a price of $5?
A: 5
B: 10
C: 15
D: 20
5
10
15
20

Which of the following events could cause the movement shown in the graph?
A decrease in income
An increase in population
A decrease in the price of a substitute
An increase in the price of a complement

Which of the following choices could cause the movement shown in the graph?
technology improves
production
inputs become cheaper
the number of firms
increases
taxes increase
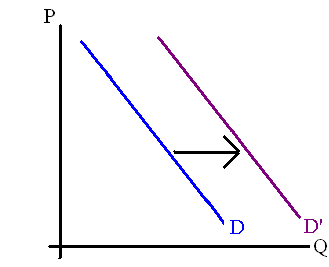
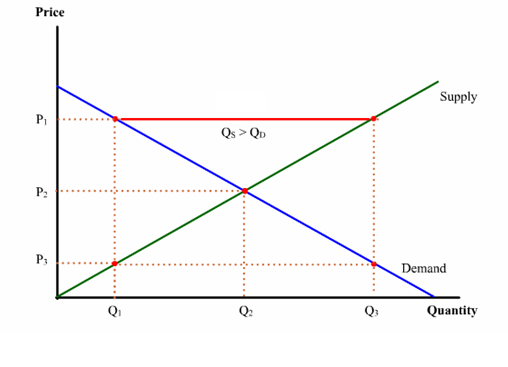
What does this graph show at P1?
Shortage
Surplus
Supply Table
Equilibrium
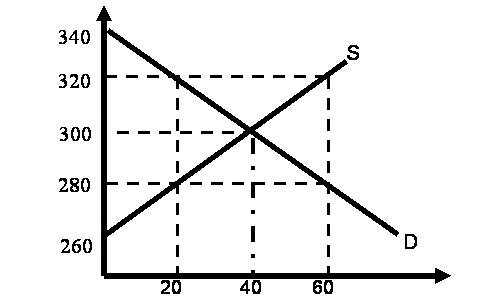


increase in quantity supplied


What does line A represent?
Surplus
Shortage
Quantity difference
Supply difference


The image here is an example of a ________, which causes a _________
Price Ceiling: Shortage
Price Ceiling: Surplus
Price Floor: Shortage
Price Floor: Surplus

The image here is an example of a _________, which causes a________
Price Ceiling: Shortage
Price Ceiling: Surplus
Price Floor: Shortage
Price Floor: Surplus

An increase in Demand is located by moving from point ________ to point_________
Moving from A to B
Moving from A to C
Moving from C to A
Moving from B to A
An increase in quantity Demanded is located by moving from point ________ to point_________
Moving from A to B
Moving from A to C
Moving from C to A
Moving from B to A
An decrease in quantity Demanded is located by moving from point ________ to point_________
Moving from A to B
Moving from A to C
Moving from C to A
Moving from B to A
An decrease in Demand is located by moving from point ________ to point_________
Moving from A to B
Moving from A to C
Moving from C to A
Moving from B to A
Which of the following supply curves demonstrates a decrease in the quantity supplied?


The prices for houses steadily increase, causing more people to want to sell their homes. Which of these demonstrates this concept?


Auto Union Workers Agree to Wage Cuts


New robot increase efficiency for Autos
Cost of Steel decreases
Major Auto producer goes out of business
Government gives Car producers Subsidies

