
 Worksheets
Unit 5 Review Math 8
Total questions: 191
Worksheet time: 7hrs 15mins

y = 4x - 12

(9, -2) (4, 3) ( 8, 10) ( -4, 8)


Find the DOMAIN
{-5, -2, 1, 4}
{1, -2, 4, -5}
{-1, 0, 2, 3}
{0, -1, 2, 3}
Find the RANGE
{-5, -2, 1, 4}
{1, -2, 4, -5}
{-1, 0, 2, 3}
{0, -1, 2, 3}

What is the domain of a relation?
the set of all x-values
the set of all y-values
Which is the set of all y-values or the outputs?
Domain
Range
Relation
Function
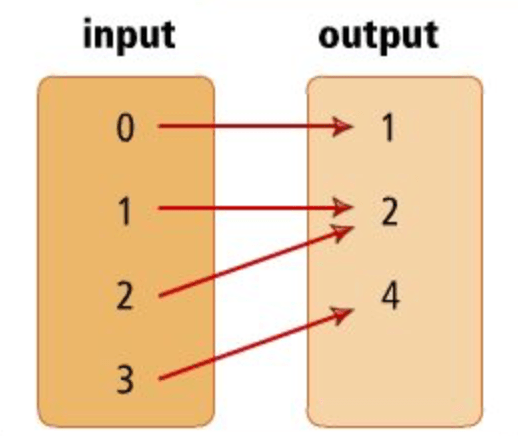
What is the range of the mapping?
{1, 2, 4}
{0, 1, 2, 3}
{0, 3}
{1, 4}
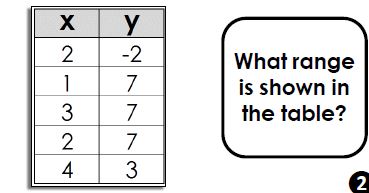
{-2, 3, 7}
[-2, 7]
{1, 2, 3, 4}
[1, 4]
Which relation does the mapping show?
{(0, 1), (1, 2),(3, 4)}
{(1, 0), (2, 1), (2, 2), (4, 3)}
{(0, 1), (1, 2), (2, 2), (3, 4)}
{(1, 0), (2, 1), (4, 3)}
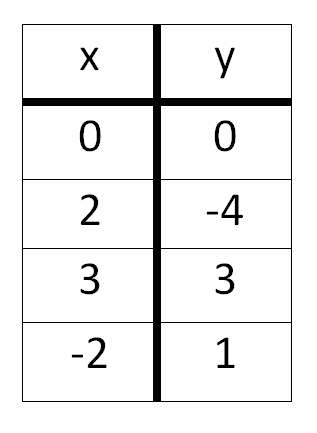
What is the range of the table?
{-4, 0, 1, 3}
{-2, 0, 2, 3}
{-4, -2, 0, 1, 2, 3}
{ (0, 0), (2, -4), (3, 3), (-2, 1) }
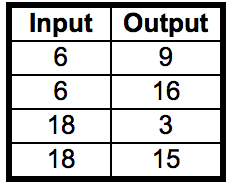
What is the domain of the relation shown in the table?
{12}
{6, 18}
{3, 9, 15, 16}
{13}
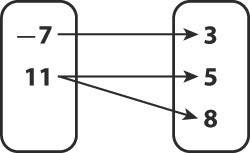
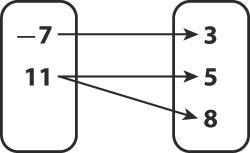
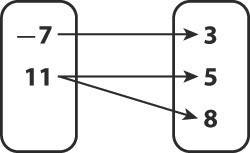
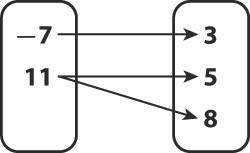
Is the relation shown a function?
No, because the x-value 11 is paired with 5 and 8.
Yes, because each x-value has only one y-value paired with it.
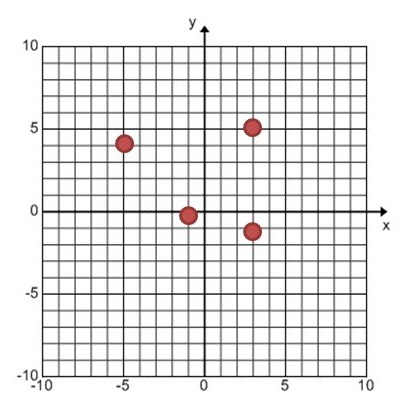
Does the graph represent a function?
Yes
No
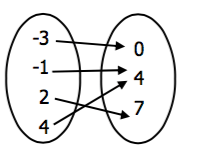
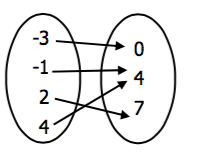
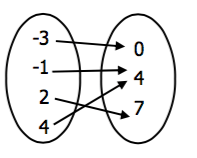
Is the relation shown in the mapping a function?
No, because -1 and 4 are pared with 4.
Yes, because every input is paired with exactly one output.
Which relation is shown in the graph?
{(4, -5), (0, -1), (-1, 3), (5, 3)}
{(-5, 4), (-1, 0), (3, -1), (3, 5)}
{(5, -4), (1, 0), (-3, 1), (-3, -5)}
{(-4, 5), (0, 1), (1, -3), (-5, -3)}
What is the range of the table?
{-4, 0, 1, 3}
{-2, 0, 2, 3}
{-4, -2, 0, 1, 2, 3}
{ (0, 0), (2, -4), (3, 3), (-2, 1) }
Does the graph represent a function?
Yes
No
R: {0, 1, 2, -4}
R:{1, -3, -4}
R:{1, -3, -4}

What is the range of the following graph?
{-5, -1, 0 , 1, 5}
{-4, -2, 0, 3, 6}
(-4, 1) ( 6, 0)
(6, 0)

Which relation has a domain of {3,7} and a range of {0,5} ?
(3,5), (3,7), (0,5), (0,3)
(3,0), (7,0), (3,5), (7,5)
(3,0), (3,5), (3,7), (7,5)
(7,0), (5,7), (3,5) (7,5)




Which graph is y=31x+2 ?


What is the slope of the line shown?
29
27
72
92
Which graph has a positive slope?


A cab company charges a $5 boarding fee in addition to its meter, which is $3 for every mile. Graph the relationship between cost and miles.


Find the slope of the line shown.
32
23
−23
−32

Write an equation in slope-intercept form (y = mx + b) for the line shown.
y=2x−3
y=−2x−3
y=21x−3
y=2x+3
State the slope and y-intercept for the graph of the equation y=−3x+5 .
The slope is 5 and y-intercept is -3.
The slope is 3 and the y-intercept is 5.
The slope is -3 and the y-intercept is 5.
The slope is -5 and the y-intercept is 3.
The slope is undefined and there is no y-intercept.

The graph shows the distance in relation to time of Ryan's sprints. There is a proportional relationship between the distance and the time. How many meters per second does Ryan sprint?
2 meters per second
6 meters per second
30 meters per second
50 meters per second

The table shows the age and height of a student over time. Interpret the meaning of the slope in the table.
The student's age decreases by this amount for every inch they grow.
The student's age increases by this amount for every inch they grow.
The student's height decreases by this amount per year.
The student's height increases by this amount per year.

Write the equation for the graph shown.
y=3
y=3x
y=x+3
x=3y
x=3

Consider the table shown. Which statements below are true? SELECT ALL THAT APPLY.
The slope is 3
The slope is -3
The y-intercept is 0.
The y-intercept is 9.

What is the equation of the line shown?
y=32x−1
y=−23x−1
y=6x+4
y=2x−1
Which graph has a slope of zero?
R: {0, 1, 2, -4}
R:{-4, -3, 1}
R:{1, -3, -4}
R: {0, 1, 2, -4}
R:{1, -3, -4}
R:{1, -3, -4}
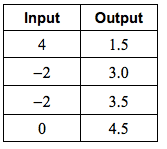
What is the domain?
the set of all x-values
the set of all y-values
What is the range?
the set of all x-values
the set of all y-values
A relation where every input in matches with exactly one output is called what?
Relation
Linear
Exponential
Function


List the ordered pairs
Input and Output
(0,12), (2,10), (4,8), (6,6)
(12,0), (10,2), (8,4), (6,6)
(6,6)

Is the equation represents a function or not?
Function
Not

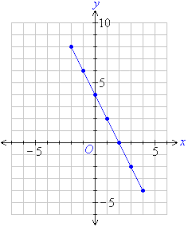


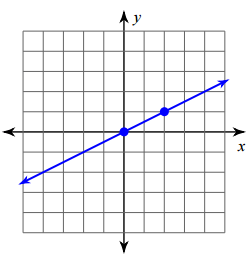

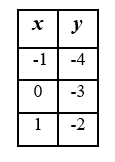
Which graph represents the table?
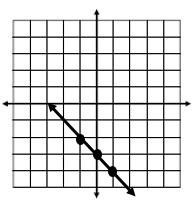
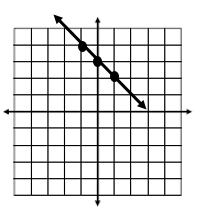
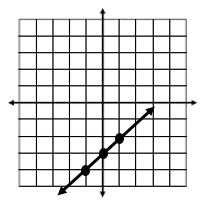
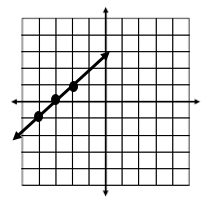
Which graph represents the equation y=4x−1
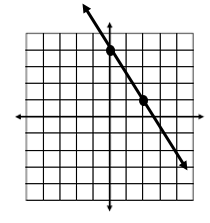
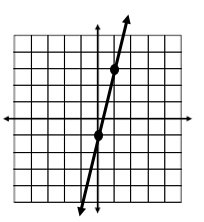
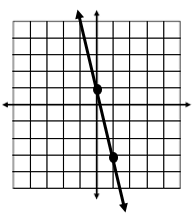
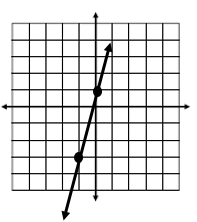

Which graph represents the table?


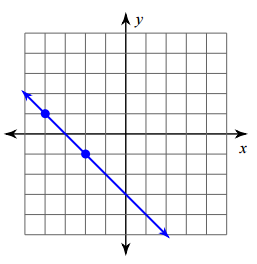

What is the slope represented in the table?
slope: 21
slope: 2
slope: −21
slope: −2

What is the Slope represented in this table?
slope: −41
slope: −4
slope: 41
slope: 4
What is the slope of the line with the equation
y = −23x + 4
−23
23
4
−4

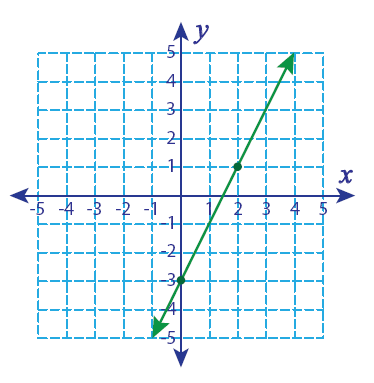
2/4

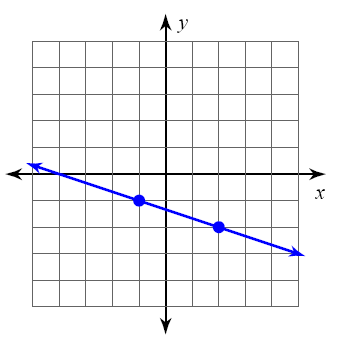
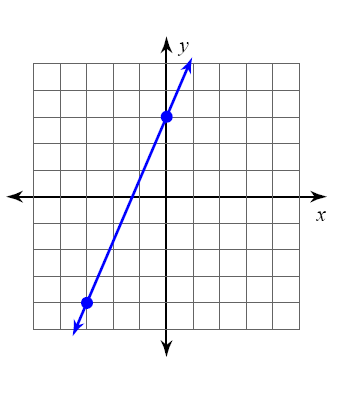

What kind of slope is this?
Positive
Negative
Zero
Undefined

Categorize the rate of change.
Positive
Zero
Negative
Undefined

Write the equation in y=mx+b form.
y=7x+3
y=7x−3
y=−3x+7
y=3x+7

Write the equation in y=mx+b.
y=4x+5
y=5x+4
y=4x+17
y=5x+3

Write an equation in y=mx+b form.
y=2x + (−3)
y=3x+2
y=2x−3
y=−3x+2

Write the equation in y=mx+b form.
y=−2x+3
y=−3x+2
y=−2x+2
y=−3x+3

Write the equation in y=mx+b form.
y=4x+2
y=−4x+2
y=−3x+14
y=3x+14

Write the equation in y=mx+b form.
y=1x+9
y=2x+13
y=3x+17
y=4x+5

Write the equation in y=mx+b form.
y=3x+7
y=2x+3
y=2x+7
y=7x+3

Write the equation in y=mx+b form.
y=8x+4
y=4x+8
y=−2x+8
y=−8x+2

Write the equation in y=mx+b form.
y=2x+2
y=2x+4
y=4x+2
y=4x+4

Write the equation in y=mx+b form.
y=3x+1
y=4x+1
y=1x+3
y=1x+4
Select the two graphs that appear to have a slope of zero.


Mr. Williams asked his students to describe the slope of the line shown. Jesse describes the slope of the line as positive because all of the x values are positive. Tia describes the slope of the line as negative because the line is decreasing from left to right. Who is correct?
Jesse
Tia
Neither

Which line (A, B, or C) has a negative slope?
Line A
Line B
Line C
Which line (A, B, or C) has a positive slope?
Line A
Line B
Line C
Which is the equation for a line with a slope of -3 and a y-intercept of 4?
y=−4x+3
y=−43x+4
y=−3x+4
y=−34x−3

Identify the slope and the y-intercept for the linear function represented in the graph.
m=2
b=1
m=21
b=−2

What are the slope and the y-intercept for the linear function represented in the table?
m=32
b=−2
m=−32
b=3

1
2
3
4

Independent: C
Dependent: C
Independent: t
Dependent: t

Which graph correctly represents the linear function?
Michelle's
Christopher's

Which equation represents the graph of the linear function shown below?
y=−3x+3
y=x+3
y=−x+3
y=21x+3
A landscaper charges each customer a flat rate of $150 to develop a plan for the landscaping of an outdoor space. The landscaper also charges $22.50 for each hour of manual labor invested in the landscaping. Write an equation to represent the relationship between the number of hours of manual labor, x, and the total cost, y, for the customer to plan and landscape an outdoor space.
y=150x+22.50
y=22.50x−150
y=150x−22.50
y=22.50x+150

In slope-intercept form, what is the b?
y = mx + b
The y-intercept
The x-intercept
The slope (rise over run)
A point on the line

In slope-intercept form, what is the m?
y = mx + b
The y-intercept
The x-intercept
The slope (rise over run)
A point on the line

Which is the equation of a line with a slope of -1/2 and a y-intercept of (0, -8)?
y = 1/2x + 8
y = -1/2x - 8
y = 2x - 8
y = -2x + 8

What is the y-intercept of the line?
(-3, 0)
(6, 0)
(0, 6)
(0, -3)

Find the slope of the line.
1/2
0
-2
-1/2

Find the slope of the line.
1/4
-1/4
-4
4
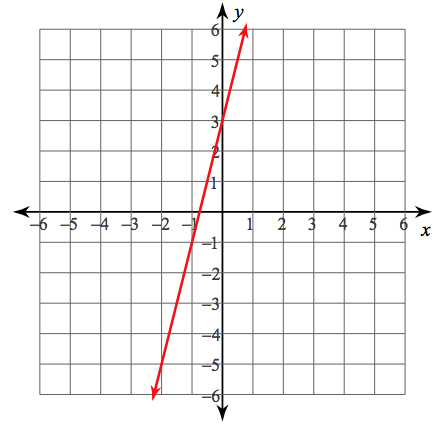
Which equation represents the graph?
y = 3x + 2
y = -1/2x + 3
y = 2x + 3
y = 1/2x + 2
Select two points that are on the line
y = 3x + 1
(1, 4)
(0, 4)
(2, 6)
(0, 1)

Write the equation for the line in slope-intercept form.
y = 2x - 4
y = -1/2x - 4
y = 1/2x - 8
y = -2x - 8

Which equation best represents the relationship between x and y in the table shown?
y = 5x + 5
y = 10x
y = x + 5
y = 5x + 10

The table shown shows a linear relationship. What is the y-intercept?
12
-3
20
4


values of the ordered pairs below?
x: -1, 0, 1, 2, 3
y: -1, 1, 3, 5, 7


y=3x + 6

A
B
C
D

F
G
H
J

A
B
C
D

F
G
H
J

A
B
C
D

F
G
H
J

A
B
C
D

F
G
H
J

A
B
C
D

F
G
H
J

A
B
C
D

F
G
H
J

A
B
C
D
A
B
C
D

F
G
H
J

A
B
C
D

F
G
H
J

A
B
C
D

F
G
H
J

A
B
C
D

F
G
H
J

A
B
C
D

F
G
H
J
Solve the equation for s
4s+12−2s+3=5s−3
s = 6
s = 3
s = -3
s = 18
Which graph represents the equation
y=2x+3


21x+7−43x=15
Solve for x.
x=−12
x=8
x=−32
x=6

2x < 20
-12y < -24
x + 5 ≤ 13

