
 Worksheets
Applied Economics_Week 2 and 4_Quiz#3
Total questions: 64
Worksheet time: 37mins
What is the state in which market supply and demand balance each other, and as a result prices become stable?
Market Price
Market Equilibrium
Market Disequilibrium
What is characterized by changes in conditions where supply and demand are out of balance?
Market Price
Market Disequilibrium
Market Equilibrium

What happens to the market when the chocolate bars are priced at $4 each?
surplus
shortage
equilibrium

What happens to the market when the chocolate bars are priced at $1 each?
shortage
surplus
equilibrium
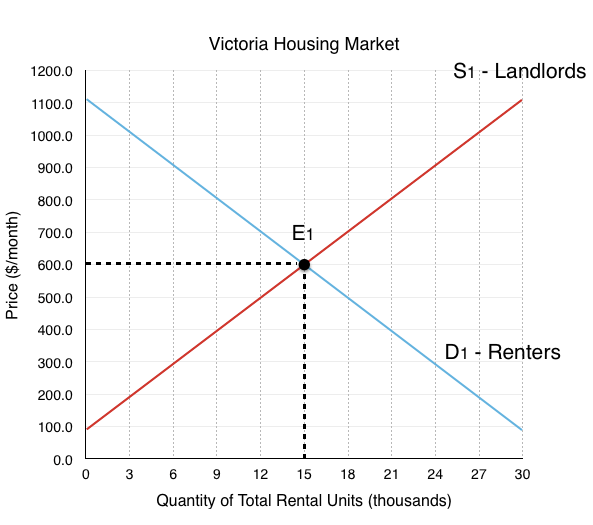
Which statement below would be the most correct to describe the equilibrium price?
$600
$600 per month
$500 per month
$700
Which statement below would be the most correct to describe the equilibrium quantity ?
15 rental houses
15000
15000 rental houses
15
What does it mean?
PED = 0
Perfectly inelastic demand
Inelastic demand
Unitarily elastic demand
Elastic demand
Perfectly elastic demand
What does it mean?
PED > 1
Perfectly inelastic demand
Inelastic demand
Unitarily elastic demand
Elastic demand
Perfectly elastic demand
What does it mean?
% change in Quantity demanded = % change in Price.
Perfectly inelastic demand
Inelastic demand
Unitarily elastic demand
Elastic demand
Perfectly elastic demand
Measurement of degree of responsiveness of quantity demanded to changes in price is called
Income elasticity of demand
Price elasticity of demand
Law of demand
Cross elasticity of demand
Products like pencils, books, and other school stationaries are easy to store in a warehouse. If a firm producing such goods and has a good warehousing facilities and can supply more when prices are rising, then supply will be
Inelastic
Unitary elasticity
Elastic
None of the above
PES =
% change in quantity supplied of the product / % change in price of the product
% change in price of the product / % change in quantity supplied of the product
% change in quantity supplied of the product * % change in price of the product
% change in quantity supplied of the product - % change in price of the product
for PES = 1
PES is perfectly elastic
PES is unitary elastic
PES is perfectly inelastic
PES is elastic
If two goods have negative price cross‑elasticities of demand, the goods are:
inferior goods.
luxury goods.
complementary goods:
substitute goods.
What does cross elasticity measure?
Measures responsiveness of changes in quantity demanded to changes in price.
Measures the responsiveness of the quantity demanded of
a good or service to a change in income.
Measures the responsiveness of the quantity demanded of one good to changes in price of another good.
If the income elasticity of market demand is negative, most consumers view the good as:
a luxury good
having many imperfect substitutes.
an inferior good.
a normal good.
Which one is the correct formula for Income Elasticity of demand?
Percentage change in income / Percentage change in quantity demand for a good
Percentage change in quantity demand for a good / Percentage change in income
Percentage change in supplied for a good / Percentage change in income
Percentage change in quantity demand for a good / Percentage change in its price
Applied economics seeks to solve the problems of scarcity. This happens when human wants for goods and services exceed the available supply.
True
False
Applied economics helps you understand the basic problems faced by the world today and can make a proposed solution
True
False
The build build build program of the government aims to help improve the infrastructure projects and other programs of the country.
True
False
It studies the way in which societies solve the fundamental problem of reconciling unlimited wants of individuals with limited resources.
Economics as Social Science
Economics as Applied Science
It formulates theories through testing and analyzing historical data.
Economics as Social Science
Economics as Applied Science
It is a powerful tool to reveal the real and exact situation in order to come with things to do.
Economics as Social Science
Economics as Applied Science
It studies how individuals make choices in allocating scarce resources to satisfy their unlimited wants.
Economics as Social Science
Economics as Applied Science
It uses scientific methods to build theories to help explain the behavior of individuals, groups and organizations.
Economics as Social Science
Economics as Applied Science
It formulates theories through testing and analyzing historical data.
Economics as Social Science
Economics as Applied Science
It is a powerful tool to reveal the real and exact situation in order to come with things to do.
Economics as Social Science
Economics as Applied Science

1. In Malthus’ 1798 book suggests there are diminishing returns to and a fixed amount of land. It follows in his argument that growing populations will eventually _____________________________. *
shrink as the land will not produce enough food to support the population’s needs
grow further as people switch from farming to fishing in oceans
stagnate

Which of the following is an economic problem?
Poverty
Traffic jam in Metro Manila
Unemployment
All of the above
What is unemployment?
It refers to a person who leave their current job
People who have no work
People who are available for work but do not find any jobs
All of the above
Which of the following is NOT TRUE about poverty?
It is a state which for a family/individual is not enough to sustain the food and non-food requirements
It is a condition where people's basic needs for foods, shelter and clothing are not being met
It occurs when people do not enjoy a certain minimum of living standards as determined by a government
None of the above
Which of the following is a cause of poverty
High inflation during crisis
Exposure to risk such as natural disasters
Both A and B
None of the above
Which of the following is a cause of unemployment
Due to people moving between jobs
Fewer jobs available in the market
Both A and B
None of the above
Which of the following statement refers to demand?
A relationship between the price of a product and the quantity demand during a given period.
It shows the number of goods that consumers are willing and able to buy
It refers to a quantity of a good service consumers would choose to buy at a particular price
All of the above
Which of the following statement does not describe the law of demand?
There is a negative relationship between price and quantity demanded
Price is directly affected by quantity demanded
It shows the relationship between price and quantity demanded
None of the above
Which of the following is TRUE about ceteris paribus?
It means that all other things held constant
It is only focused on market demand
It refers to factors of demand shift
None of the above
Which of the following scenarios causes the demand to shift upward?
Consumers are satiated with product
Increase in consumer's income
The price is expected to decrease next week
None of the above
Which of the following factors does not cause a shift in the demand curve?
Price
The income of future prices
Expectations of future prices
None of the above
It is a situation where demand exceeds supply
Scarce
Sufficient
Surplus
Shortage
It is a situation where demand is equal to supply
Price Stability
Market Equilibrium
Fairness and Equity
Economic Growth
It is a situation where supply is greater than demand
Shortage
Surplus
Scarce
Sufficient
In a graph, all points below the equilibrium point are:
Surplus
Shortage
Sufficient
Scarce
In a graph, all points above the equilibrium point are:
Surplus
Shortage
Scarce
Sufficient
It refers to the legal minimum or maximum prices set for specified goods
Price Controls
Price Floor
Price Ceiling
None of the above
It refers to the maximum prices set by the government for products
Price Controls
Price Floor
Price Ceiling
None of the above
This happens when the government imposed a price ceiling
Equilibrium
Shortage
Surplus
None of the above
This is where the price ceiling located in the graph
Above equilibrium point
Parallel to the equilibrium point
Below equilibrium point
None of the above
This happens when the price is not allowed to increase
The new equilibrium price is formed
The decrease in quantity demand
Increase in quantity supplied
None of the above
It measures how the quantity demand changes as the price of related goods changes
Price Elasticity of Demand
Cost Elasticity of Demand
Product Elasticity of Demand
Cross Elasticity of Demand
It measures how the quantity demanded changes as consumer's income changes
Price Elasticity of Demand
Income Elasticity of Demand
Budget Elasticity of Demand
Cross Elasticity of Demand
The change in a factor which leads to a greater change in quantity demanded or supplied
Elastic
Inelastic
Unitary Elastic
None of the above
The change in a factor which leads to a greater change in quantity demanded or supplied
Elastic
Inelastic
Unitary Elastic
None of the above
A measure of the extent to which the quantity demanded of a good change when the price of the good changes
Income Elasticity of Demand
Cross Elasticity of Demand
Price Elasticity of Demand
None of the above
It measures the responsiveness of buyers and sellers on the changes in the market comditions
Elastic
Inelastic
Elasticity
Inelasticity
This happens when the price is allowed to increase
Surplus
Equilibrium
Shortage
None of the above
This is where the price floor located in the graph
Below equilibrium point
Above equilibrium point
Parallel to the equilibrium point
None of the above
A price floor is necessary to implement during this market condition
Equilibrium
Shortage
Surplus
None of the above
It is a common example of a price floor
Minimum wage
Sale and promotion
Discounts
None of the above
It refers to the legal minimum prices set for specified goods and services
Price Controls
Price Floor
Price Ceiling
None of the above

