wayground logo

Free Printable Worksheets

Font size

S
M
L
XL
Worksheets

Working Scientifically

Total questions: 35

Worksheet time: 20mins
Name
Class
Date
1.
We include anomalies when calculating a mean ...
a)
True
b)
False
2.
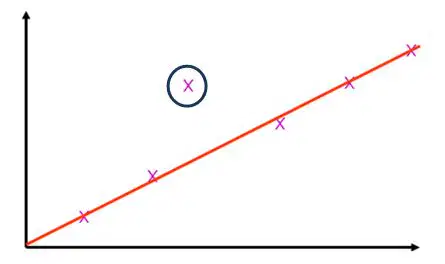
Why is the result circled?
a)

It is reproducible

b)

It is the range

c)

It is the mean

d)

It is anomalous

3.

Write 12.625 to 1 decimal place

(a)  

4.

Write 12.625 to 2 significant figures

(a)  

5.

Write 9.554 to 2 decimal places

(a)  

6.

Write 9.554 to 2 significant figures

(a)  

7.

Calculate the mean of the set of data below:

(a)  

8.

State the range of the set of data below:

(a)  

9.

Identify the anomaly in the set of data below:

(a)  

10.

Students in a biology class planted five tomato seeds in separate containers. They exposed the seeds to an artificial light source for twenty days. At the end of the twenty days, the students measured the height of the tomato plant that grew from those seeds. The data is shown below. What is the mean of the data?

(a)  

11.
Which type of variable do we keep the same in an investigation?
a)
Control
b)
Dependent
c)
Independent
12.
Which type of variable do we measure in an investigation?
a)
Control
b)
Dependent
c)
Independent
13.
Which type of variable do we change in an investigation?
a)
Control
b)
Dependent
c)
Independent
14.
Keith is investigating how the height at which a ball is dropped affects the height of the bounce. What variable is the height of the bounce?
a)
Control
b)
Dependent
c)
Independent
15.
Keith is investigating how the height at which a ball is dropped affects the height of the bounce. Which of the following could be a control variable?
a)
Size of the ball
b)
Height of the bounce
c)
Drop height
16.
Kevin is investigating how the temperature of tea affects how much sugar will dissolve in it. Which of the following is the independent variable?
a)
The temperature of the tea
b)
The amount of milk in the tea
c)
The amount of sugar that dissolves in the tea
d)
The type of sugar
17.

Kevin is investigating how the temperature of tea affects how much sugar will dissolve in it. What would make this an invalid test?

a)

Having more than one independent variable

b)

Having more than one control variable

c)

Having more than one dependent variable

18.
On which axis does the dependent variable go on?
a)

X axis

b)

Y Axis

c)

You don't plot the dependent variable on a graph

19.
Graham is investigating how the height of a student is affected by their age. Which of the following is the independent variable?
a)
Height of the student
b)
Gender
c)
Age
20.
Graham is investigating how the height of a student is affected by their age. Which of the following is the control variable?
a)
Height of the student
b)
Gender
c)
Age
21.
Jefferson is investigating how the mass of a planet affects the gravitational field strength of the planet, what is the gravitational field strength of the planet?
a)
The dependent variable
b)
The independent variable
c)
The control variable
22.
Geoff is investigating how the mass of a car affects the time taken for the car to come to a stop. What would be the independent variable?
a)
The mass of the car
b)
The time taken to stop
c)
The colour of the car
23.
Which type of variable do we change in an investigation?
a)
Control
b)
Dependent
c)
Independent
24.
Which type of data will fall into categories?
a)
Discontinuous
b)
Continuous
25.
Which type of data can take any value?
a)

Discontinuous

b)

Continuous

26.
Which type of graph do we plot continuous data on?
a)

Bar graph

b)

Line graph

c)

Histogram

d)

Pie chart

e)

Scatter graph

27.
Which type of graph do we plot categoric data on?
a)
Bar graph
b)
Line graph
c)
Histogram
d)
Pie chart
28.
Which type of data is hair colour?
a)

Categoric

b)

Continuous

c)

Discontinuous

29.
Which type of data is height?
a)

Categoric

b)

Continuous

c)

Discontinuous

30.
Which type of graph would we plot if we were representing the types of breakfast had by different people?
a)
Bar Chart
b)
Line graph
c)
Pie chart
d)
Histogram
31.
On which axis does the independent variable go on?
a)
X axis
b)
Y Axis
c)
You don't plot the independent variable on a graph
32.
What is the independent variable?
a)
Energy
b)
Temperature
c)
Time
33.
Which type of data is this?
a)

Categoric

b)

Continuous

c)

Discontinuous

34.
Which type of data is this?
a)

Continuous data

b)

Discontinuous data

35.
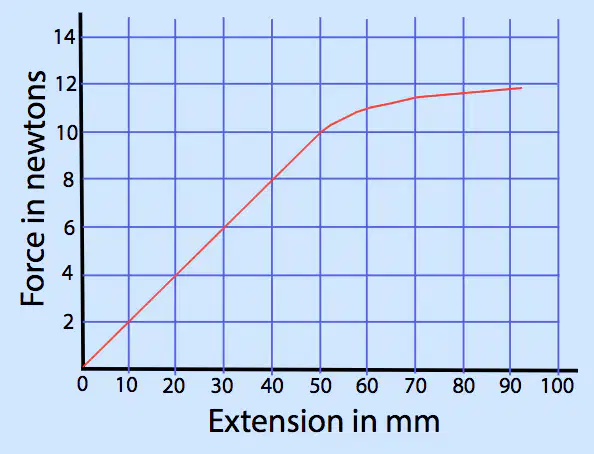
Which phrase best describe the trend?
a)
As the force increases so does the extension at the same rate
b)
As the force increases so does the extension at a different rate
c)
As the force increases the extension decreases at the same rate
d)
As the force increases the extension decreases at a different rate