
 Worksheets
College Algebra: Unit 2 Preview
Total questions: 50
Worksheet time: 3hrs 28mins


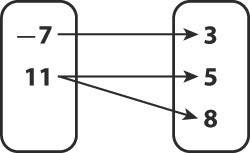
Is the relation shown a function?
No, because the x-value 11 is paired with 5 and 8.
Yes, because each x-value has only one y-value paired with it.

Is this mapping a function and how can you tell?
Yes its a function cause all the numbers have lines
No it's not a function because there a 5 in both ovals
No it's not a function because the x value 5 has 2 outputs.
No it's not a function because the y value 5 has 2 inputs.
The range of a function refers to which variable:
X
Y
Both X and Y
None of the above
Given the domain below listed in interval notation, what is the domain written in inequality notation?
[0, 5)
Domain: 0 < x < 5
Domain: 0 < x < 5
Range: 0 < y < 5
Domain: 0 < x < 5
Given the domain below listed in interval notation, what is the domain written in inequality notation?
(2, 17]
Domain: -2 < x < 17
Domain: -2 < x < 17
Domain: -2 < x < 17
Domain: -2 < x < 17
Given the domain below, written in inequality notation, what is the domain when written in interval notation?
D: -2 < x < 5
(-2, 5)
[-2, 5)
(-2, 5]
[-2, 5]
Given the domain below, written in inequality notation, what is the domain when written in interval notation?
D: 147 < x < 695
(147, 695)
[147, 695)
(147, 695]
[147, 695]
Which of the following graphs has a domain of x > 0 ?


What is the range?
{0, 1, 2, 15}
(0, 1, 2, 3}
{3, 7, 11, 15}
{3, 7, 11, 3}
What is the domain?
{0, 1, 2, 15}
(0, 1, 2, 3}
{3, 7, 11, 15}
{3, 7, 11, 3}
What is the degree of the polynomial y=3y2+y4−7x3+1 ?
2
3
4
1
What is the leading coefficient of the polynomial y=5y3+2y6−9x4+x−2 ?
-9
2
5
- 2

Is the degree of the graphed polynomial even or odd?
Odd
Even

Is the degree of the graphed polynomial even or odd?
Even
Odd

Using the graph, what can we assume about the equation?
Degree - Even
Leading Coefficient - Positive
Degree - Odd
Leading Coefficient - Positive
Degree - Even
Leading Coefficient - Negative
Degree - Odd
Leading Coefficient - Negative

Using the graph, what can we assume about the equation?
Degree - Even
Leading Coefficient - Positive
Degree - Odd
Leading Coefficient - Positive
Degree - Even
Leading Coefficient - Negative
Degree - Odd
Leading Coefficient - Negative

Using the graph, what can we assume about the equation?
Degree - Even
Leading Coefficient - Positive
Degree - Odd
Leading Coefficient - Positive
Degree - Even
Leading Coefficient - Negative
Degree - Odd
Leading Coefficient - Negative

Using the graph, what can we assume about the equation?
Degree - Even
Leading Coefficient Positive
Degree - Odd
Leading Coefficient Positive
Degree - Even
Leading Coefficient Negative
Degree - Odd
Leading Coefficient Negative


p(x) = f(x + 3)
Reflection across the x-axis
Vertical shift right 2 units
Horizontal shift down 7 units
Vertical Stretch of 2
Horizontal shift left 1 unit
Vertical shift down 9 units
Given f(x−3)+5 . What transformations took place from the original function f(x)?
Left 3 and up 5
Right 3 and down 5
Left 3 and down 5
Right 3 and up 5

Identify the transformation from the graph of f(x)=sin(x) to the graph of g(x)=−sin(x+5)
shifted up five units
reflection in x-axis
shifted down five units
reflection in x-axis
shifted left 5 units
reflection x-axis
shifted right 5 units
reflection x-axis

The relation in the graph is..
a function but not a one-to-one function.
a one-to-one function.
not a function

The relation in the graph is..
a function but not a one-to-one function.
a one-to-one function.
not a function

The relation in the graph is..
a function but not a one-to-one function.
a one-to-one function.
not a function

The relation in the graph is..
a function but not a one-to-one function.
a one-to-one function.
not a function

The relation in the graph is..
a function but not a one-to-one function.
a one-to-one function.
not a function

The relation in the graph is..
a function but not a one-to-one function.
a one-to-one function.
not a function

The relation in the graph is..
a function but not a one-to-one function.
a one-to-one function.
not a function.

The relation in the graph is..
a function but not a one-to-one function.
a one-to-one function.
not a function.
(1,3)(2,4)(6,8)


Which is the inverse of the table?


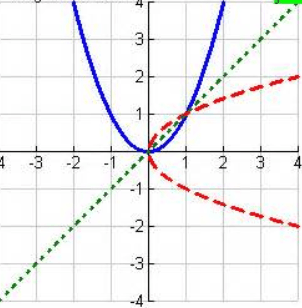
Are the blue and red graphs inverse functions?
Yes, the functions reflect over y = x
No, they do not reflect over the x - axis.
No way to tell from a graph
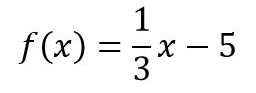
Which is f -1(x)?
f -1(x) = 3x + 5
f -1(x) = 3x - 5
f -1(x) = 3x - 15
f -1(x) = 3x + 15

