
 Worksheets
PSQ Training Session 3
Total questions: 100
Worksheet time: 3hrs 45mins
Median, mode, deciles and percentiles are all considered as measures of _____.
mathematical averages
sample averages
population averages
averages of position
In two units of company, employees in unit one are 650 and monthly salary is $2,750, employees in unit two are 700 and monthly salary is $2,500 then combined arithmetic mean is _____.
$2,620
$2,420
$2,520
$2,320
If most repeated observations recorded are outliers of data then mode is considered as _____.
intended measure
best measure
percentage measure
poor measure
Number of observations are 30 and value of arithmetic mean is 15 then sum of all values is _____.
15
45
200
450
The value of Σfx is180, A = 22, and width of class interval is 5, arithmetic mean is 120 then observations are _____.
30
39
49.5
59
The value of Σfx is 300, A = 35,number of observations are 15 and width of class interval is 5 then arithmetic mean is _____.
135
145
150
235
Quartiles, median, percentiles and deciles are measures of central tendency classified as _____.
central averages
deviation averages
paired averages
positioned averages
Considering probability distribution, if mode is greater than median then distribution is classified as _____.
constant model
left skewed
right skewed
variable model
The frequency distribution whose most values are dispersed to left or right of mode is classified as _____.
Binomial
Explored
Skewed
Unimodal
If arithmetic mean is 25 and harmonic mean is 15 then geometric mean is _____.
15.36
16.36
17.36
19.36
If central tendency is found by using whole population as input data then this is classified _____.
population parameters
population statistic
Population parameters
Sample statistic
The criteria of inferential statistics which considers sum of squared deviations is classified as _____.
central squares criterion
least squares criterion
multiple squares criterion
outliers square criterion
In a negative skewed distribution, order of mean, median and mode is as _____.
mean < median > mode
mean < median < mode
mean > median > mode
mean > median < mode
The measure which describes detailed characteristic of whole data set is classified as _____.
central value
negative skewed value
positive extended value
positive skewed value
In arithmetic mean, sum of deviation of all recorded observations must always be _____.
Negative one
Zero
One
Two
The distribution whose outlier are higher value is considered as _____.
constant model
left skewed
right skewed
variable model
The distribution whose outlier are higher value is considered as _____.
constant model
left skewed
right skewed
variable model
In quartiles, central tendency median to be measured must lie in _____.
first quartile
second quartile
third quartile
fourth quartile
In quartile, central tendency median to be measured must lie in _____.
first quartile
second quartile
third quartile
fourth quartile
The arithmetic mean is 12 and the number of observations are 20, then the sum of all values is _____.
1.667
8
32
240
At a grocery store, the number of per day sold processed fruits cans in 15 days are 50, 70, 60, 40, 30, 20, 5, 150, 55, 75, 65, 45, 35, 25, 52, then outliers in observations are _____.
5, 150
25, 70
50, 150
150
The measure of central tendency which represents over time multiplicative effects for inflation and compound interest is considered a _____.
deviation square mean
geometric mean
harmonic mean
paired mean
Around central value of observations, extent to which values depart from normal distribution is classified as _____.
negative variation
positive variation
positive trailing
skewness
Product W has per unit contribution of 8 with sold quantity of 124 units, product X has per unit contribution of 5 with sold quantity of 105 units, product Y has per unit contribution of 9 with sold quantity of 135 units, product Z has per unit contribution of 12 with sold quantity of 140 units then weighted average mean is _____.
$11.75
$10.75
$9.75
$8.75
In measure of central tendency, population parameter is denoted by _____.
μ
x
σ
s2
Type of central tendency measures which divides data set into 100 equal parts is classified as _____.
deciles
percentiles
quartiles
median
If the value of three measures of central tendencies median, mean and mode then distribution is considered as _____.
bimodal
negatively skewed modal
triangular model
unimodal
Product A has a per unit contribution of 6 with sold quantity of 120 units, product B has per unit contribution of 8 with sold quantity of 100 units and product C has per unit contribution of 10 with sold quantity of 130 units then weighted average mean is _____.
$7.06
$8.06
$9.06
$10.06
The concept used in calculation of index numbers and where smaller observations must be taken into consideration is called _____.
deviation square mean
geometric mean
paired mean
harmonic mean
If arithmetic mean is 20 and harmonic mean is 30 then geometric mean is _____.
14.94
24.94
34.94
44.94
33, 25, 42, 25, 31, 37, 46, 29, 38
What is the third quartile (Upper Quartile) of the data using Mendenhall and Sincich method?
37
38
40
46
What is the upper quartile of the data using Linear Interpolation?
3.9, 4.1, 4.2, 4.3, 4.3, 4.4, 4.6
4.175
4.275
4.375
4.5
none of these
Yes FM 101.1 station has a low number of listeners. 75% of all country stations in the Philippines have more listeners than this station.
---
Let the data set "L" consist of the number of listeners for each country station in the Philippines. Which of the following is a true statement about the Yes FM 101.1 station's position in L?
It is between the 2nd and the 3rd deciles
It is below the 2nd decile
It is between the 7th and the 8th deciles
It is above the 8th decile
What is the median of this set of score?
1, 2, 5, 6, 8, 8, 9, 12, 15
6
8
9
none of these
This fractile divides the set into 4 equal parts.
Median
Quartile
Quantile
Decile
Percentile
What is the median height (in cm) of the following:
140, 148, 150, 152, 155, 157, 159, 160, 161, 164, 165, 166
157 cm
158 cm
159 cm
none of these
Find the upper and lower quartile respectively of the following scores using Mendenhall and Sincich method.
1, 3, 7, 7, 16, 21, 27, 30, 31
7 and 27
5 and 28.5
7 and 30
none of these
Erika Embang receives a salary in the 7th decile. Should she pleased with her salary? explain.
Yes, because most of the employees receive the salary less than or equal than hers.
No, because the salary is not sufficient to her needs.
Yes, because only 30% of the employees receiving salary greater than hers.
No, because 50% of the employees are receiving the salary as hers.

Using the distribution table, find the total frequency.
50
80
90
100

Using the table, how many students whose height is less than or equal to 1.74 meters?
25
33
63
81

From the given table, what is the lower boundary of the median class?
1.845
1.745
1.645
1.545

If Abby has a percentile rank of 40, what is her height using the given table?
1.53 meters
1.66 meters
1.75 meters
1.83 meters

Approximately how tall is Faye if her height equals the 3rd decile? *Refer to the given table
1.63 meters
1.66 meters
1.75 meters
1.87 meters

What is decile rank of Gwen if her height is 1.80 meters? *Refer to the given table
2
4
6
8
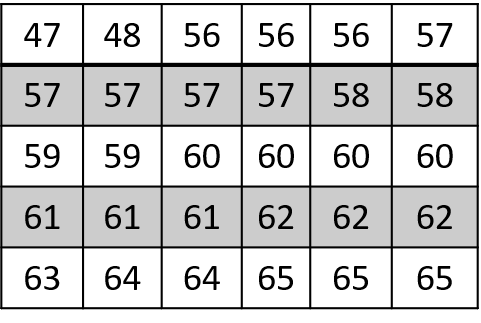
Using the table, the scores on a summative examination are presented below in decreasing order of magnitude. A score of 63 is approximately equivalent to a percentile rank of ______.
20
25
63
82
In an 80-item test, the passing mark is the 3rd quartile. What does it imply?
The students should answer at least 60 items correctly.
The students should answer at least 40 items correctly.
The students should answer at most 60 items correctly.
The students should answer at most 40 items correctly.
If a student discovers that his grade on a recent test was the 72nd percentile. If 90 students took the test, then approximately how many students received a higher grade than he did?
72
62
25
18
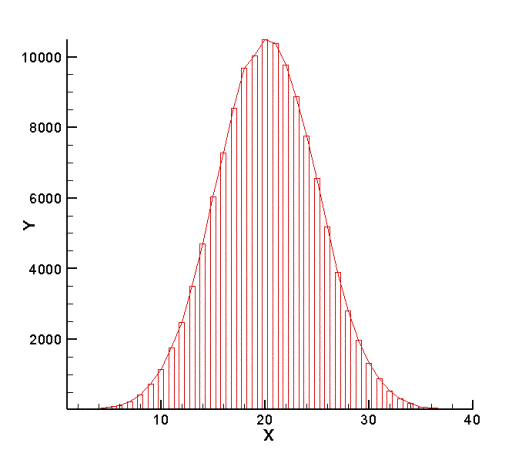

uniform
symmetric
skewed to the left
skewed to the right

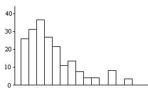



What is the shape of this data?
symmetric
skewed right
skewed left
uniform

What is the shape of this bar graph?
Skew right
Skew left
Symmetrical
uniform

What is the shape of this data?
uniform
skewed left
skewed right
symmetric


Describe the shape of Daniel's data
skewed left
skewed right
symmetrical

The following dot plot is
skewed left
skewed right
symmetrical
Determine the distribution of a data set with a mean = 2.5, Median = 3.5, and a Mode = 5
Symmetrical
Skewed left
Skewed right
Uniformed
Determine the distribution of the data set that has a mean = 6, a median = 5.5, and a mode of 5.
Symmetrical
Skewed left
Skewed ight
Uniform
Determine the distribution of the data set that has a mean = 10, median = 10, and a mode = 10
Symmetrical
Skewed left
Skewed right
Uniform
Determine the skewness of the data set below:
1, 2, 2, 3, 3, 3, 4, 4, 5
Symetrical
Skewed left
Skewed right
Uniform
Determine the skewness of the data set below:
5, 6, 7, 8, 8, 9, 9, 9, 10, 10, 10, 10, 10, 10, 10
Symmetric
Skewed left
Skewed right
Uniform

31. What is the class width of the given FDT?
9
8
7
6
32. What is the total frequency of the given FDT?
92
93
94
95
36. How many students have scores that are not higher than 74?
20
32
61
81
37. What percentage of the students had an average score of 50?
12%
12.90%
18%
19.35%
33. What is the cummulative frequency of the 5th row?
93
88
81
61
34. What is the relative frequency of the highest frequency?
0.24
0.22
0.20
0.19
39. What is the classmark with the relative frequency of 9.68%?
71
64
57
43
39. What is the classmark with the highest frequency?
85
71
64
57
15. Given x1 =274, x2 =235, x3 =223, x4 =268, x5 =290, x6 =285,
and x7 =235 . Find ∑ x
1,810
1,536
1,525
1,520
16. Given x1 =274, x2 =235, x3 =223, x4 =268, x5 =290, x6 =285,
and x7 =235 . Find ∑ x2−1000
3,273,100
3,274,100
3,275,100
3,276,100

Which of the following measure of central tendency can be used for ordinal variables?
Range
Mean
Median
Mode
The result of a survey shows 15 were 10s, 20 were 5s, and 30 were 20s. What is the mean?
24.28
16.67
13.08
141.67
The life of car batteries (in years) was obtained by manufacturing company and the following information were taken: 3.4, 1.8, 2.1, 3.5, 4.0, 2.4, 2.7, 3.2, 3.6 and 4.2. What is the median?
5.50
3.30
3.20
3.10
How do you classify the mode of the given set: 25, 30, 18, 18, 27, 15, 15, 30?
No mode
Unimodal
Bimodal
Trimodal

Find the interquartile range score.
92.75
92.50
92.25
92.00
What is the range?
65
64
63
61
What is the sample variance?
393.46
393.47
393.48
393.49
Find the sample standard deviation.
19.34
19.54
19.84
19.94
Given the population size and margin of error, determine the sample size.
1. N = 40 000 e = 10%
90
100
110
120
2. Given the population size and margin of error, determine the sample size.
N = 15 000 e = 5%
370
380
390
400
3. Given the population size and margin of error, determine the sample size.
N = 20 000 e = 2%
5,555
4,444
3,333
2,222

Given the date below, what is the value of N?
30
40
50
60

Find the mean.
10
20
30
40

Md=L +(f2n−<cF)i
Find the median. Using the formula above.
32.6
56.9
66.51
68.10

Mode=L + (d1+d2d1)i
Find the mode using the formula above.
35.18
33.12
25.66
22.71

If mode is the most frequent of a set of data, in which class does the modal class belongs?
16-19
20-23
24-27
44-47

