
 Worksheets
Topic 2: Question Set 2-Microsoft PL-300 Exam
Total questions: 82
Worksheet time: 48mins
You are creating a report in Power BI Desktop.
You load a data extract that includes a free text field named coll.
You need to analyze the frequency distribution of the string lengths in col1. The solution must not affect the size of the model.
What should you do?

In the report, add a DAX calculated column that calculates the length of col1
In the report, add a DAX function that calculates the average length of col1
From Power Query Editor, add a column that calculates the length of col1

From Power Query Editor, change the distribution for the Column profile to group by length for col1
You have a collection of reports for the HR department of your company. The datasets use row-level security (RLS). The company has multiple sales regions.
Each sales region has an HR manager.
You need to ensure that the HR managers can interact with the data from their region only. The HR managers must be prevented from changing the layout of the reports.
How should you provision access to the reports for the HR managers?
Publish the reports in an app and grant the HR managers access permission.
Create a new workspace, copy the datasets and reports, and add the HR managers as members of the workspace.
Publish the reports to a different workspace other than the one hosting the datasets.
Add the HR managers as members of the existing workspace that hosts the reports and the datasets.
You need to provide a user with the ability to add members to a workspace. The solution must use the principle of least privilege.
Which role should you assign to the user?
Viewer
Admin
Contributor

Member

(VOTE: 32%) You have a Power BI query named Sales that imports the columns shown in the following table.
Users only use the date part of the Sales_Date field. Only rows with a Status of Finished are used in analysis.
You need to reduce the load times of the query without affecting the analysis.
Which two actions achieve this goal? Each correct answer presents a complete solution.
NOTE: Each correct selection is worth one point.
Remove the rows in which Sales[Status] has a value of Canceled.
Remove Sales[Sales_Date].
Change the data type of Sale[Delivery_Time] to Integer.
Split Sales[Sale_Date] into separate date and time columns.
Remove Sales[Canceled Date].
(VOTE: 68%) You have a Power BI query named Sales that imports the columns shown in the following table.
Users only use the date part of the Sales_Date field. Only rows with a Status of Finished are used in analysis.
You need to reduce the load times of the query without affecting the analysis.
Which two actions achieve this goal? Each correct answer presents a complete solution.
NOTE: Each correct selection is worth one point.
Remove the rows in which Sales[Status] has a value of Canceled.
Remove Sales[Sales_Date].
Change the data type of Sale[Delivery_Time] to Integer.
Split Sales[Sale_Date] into separate date and time columns.
Remove Sales[Canceled Date].
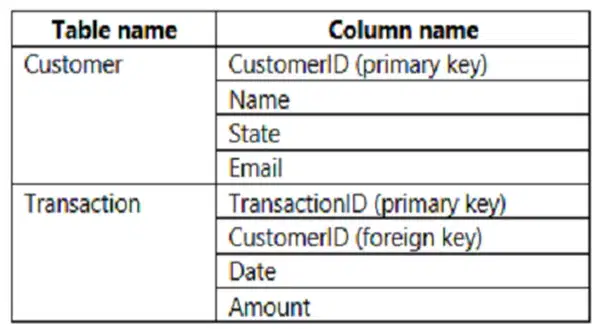
You build a report to analyze customer transactions from a database that contains the tables shown in the following table.
You import the tables.
Which relationship should you use to link the tables?
one-to-many from Transaction to Customer
one-to-one between Customer and Transaction
many-to-many between Customer and Transaction

one-to-many from Customer to Transaction
You have a custom connector that returns ID, From, To, Subject, Body, and Has Attachments for every email sent during the past year. More than 10 million records are returned.
You build a report analyzing the internal networks of employees based on whom they send emails to.
You need to prevent report recipients from reading the analyzed emails. The solution must minimize the model size.
What should you do?
From Model view, set the Subject and Body columns to Hidden.

Remove the Subject and Body columns during the import.
Implement row-level security (RLS) so that the report recipients can only see results based on the emails they sent.
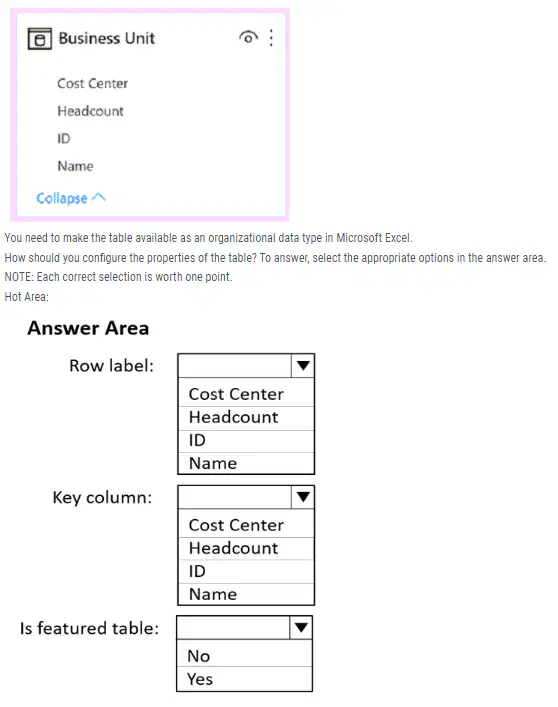
You create a Power BI dataset that contains the table shown in the following exhibit.
You need to make the table available as an organizational data type in Microsoft Excel.
How should you configure the properties of the table? To answer, select the appropriate options in the answer area.
NOTE: Each correct selection is worth one point.


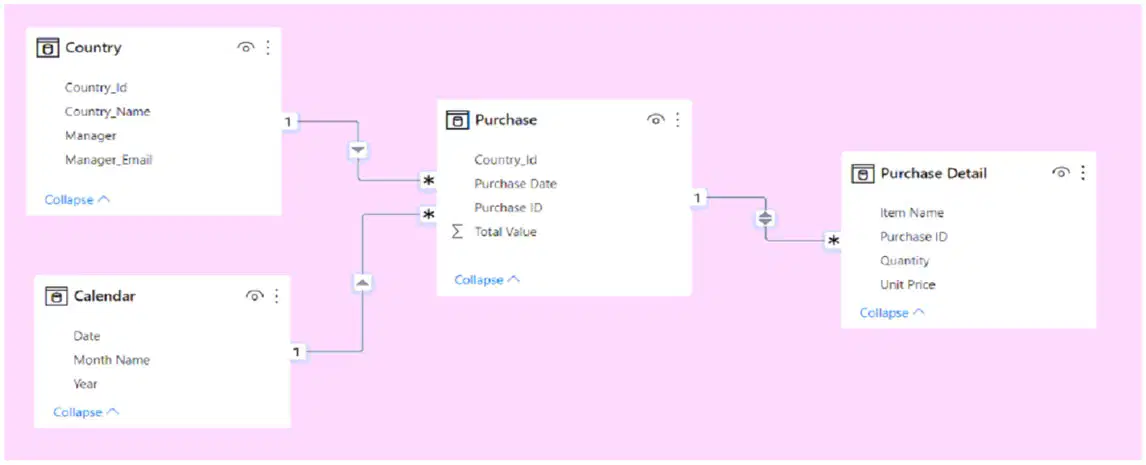
You have the Power BI model shown in the following exhibit.
A manager can represent only a single country.
You need to use row-level security (RLS) to meet the following requirements:
✑ The managers must only see the data of their respective country.
✑ The number of RLS roles must be minimized.
Which two actions should you perform? Each correct answer presents a complete solution.
NOTE: Each correct selection is worth one point.

Create a single role that filters Country[Manager_Email] by using the USERNAME DAX function.
Create a single role that filters Country[Manager_Email] by using the USEROBJECTID DAX function.
For the relationship between Purchase Detail and Purchase, select Apply security filter in both directions.
Create one role for each country.
For the relationship between Purchase and Purchase Detail, change the Cross filter direction to Single.

You have a Power BI imported dataset that contains the data model shown in the following exhibit.
Use the drop-down menus to select the answer choice that completes each statement based on the information presented in the graphic.
NOTE: Each correct selection is worth one point.


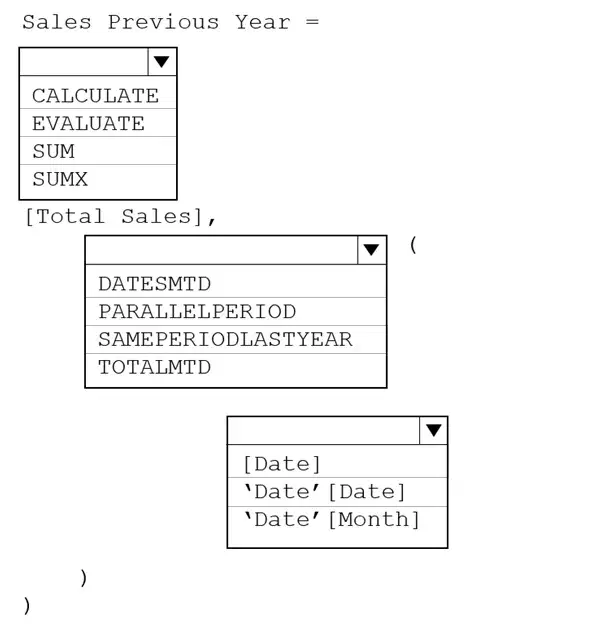
HOTSPOT -
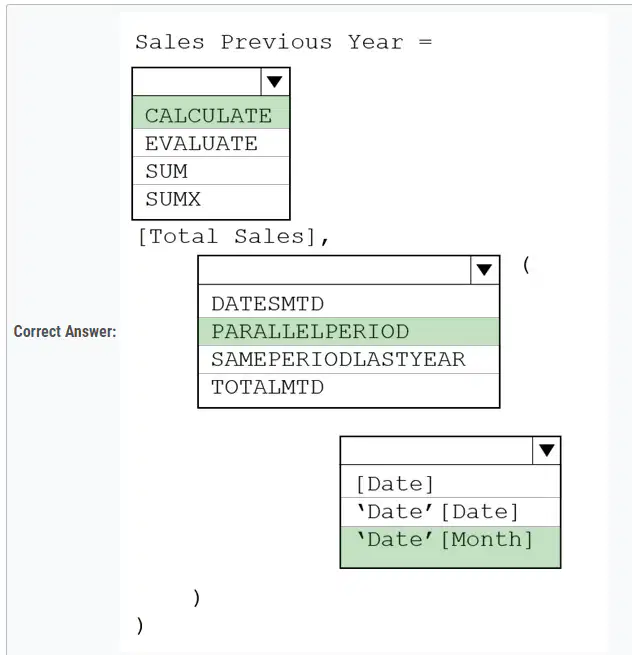
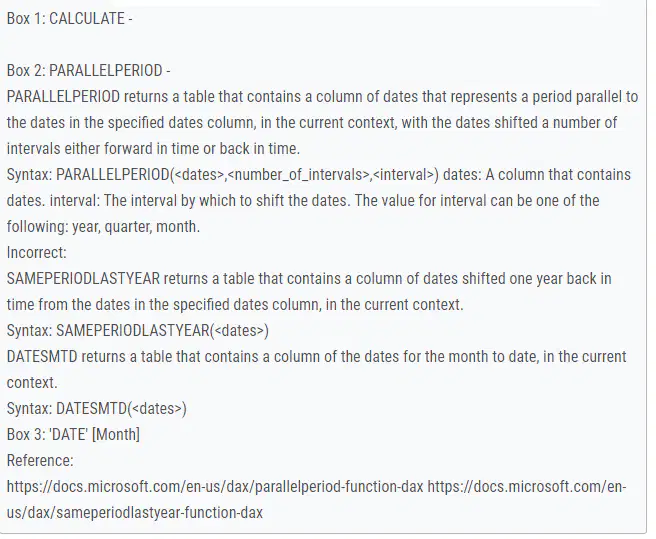
You have a Power BI model that contains a table named Sales and a related date table. Sales contains a measure named Total Sales.
You need to create a measure that calculates the total sales from the equivalent month of the previous year.
How should you complete the calculation? To answer, select the appropriate options in the answer area.
NOTE: Each correct selection is worth one point.
Hot Area:

DRAG DROP -
You plan to create a report that will display sales data from the last year for multiple regions.
You need to restrict access to individual rows of the data on a per region-basis by using roles.
Which four actions should you perform in sequence? To answer, move the appropriate actions from the list of actions to the answer area and arrange them in the correct order.
Select and Place:

You can define roles and rules within Power BI Desktop. When you publish to Power BI, it also publishes the role definitions.
To define security roles, follow these steps.
1. Import data into your Power BI Desktop report (Step 1)
2. From the Modeling tab, select Manage Roles.
3. From the Manage roles window, select Create. (Step 2)
4. Under Roles, provide a name for the role.
5. Under Tables, select the table to which you want to apply a DAX rule.
6. In the Table filter DAX expression box, enter the DAX expressions. This expression returns a value of true or false. For example: [Entity ID] = ג€Valueג€(Step 3)
7. After you've created the DAX expression, select the checkmark above the expression box to validate the expression.
8. Select Save.
Step 3: Assign Users to the role.
You can't assign users to a role within Power BI Desktop. You assign them in the Power BI service.
After you've created your roles, test the results of the roles within Power BI Desktop.
Step 4: Publish the report.
Now that you're done validating the roles in Power BI Desktop, go ahead and publish your report to the Power BI service.
Reference:
https://docs.microsoft.com/en-us/power-bi/enterprise/service-admin-rls
DRAG DROP -
You create a data model in Power BI.
Report developers and users provide feedback that the data model is too complex.
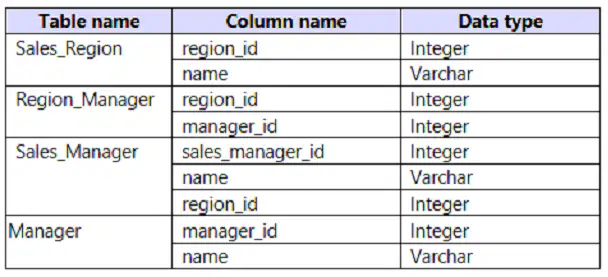
The model contains the following tables.
The model has the following relationships:
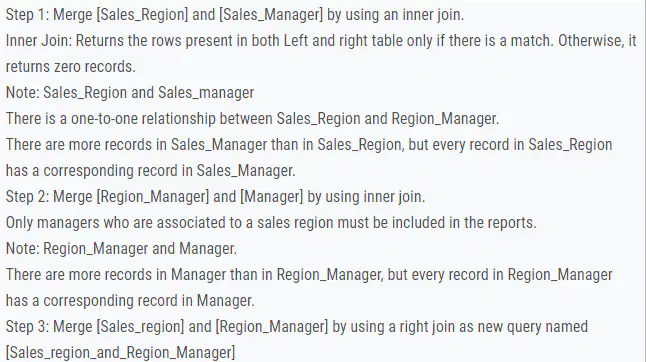
✑ There is a one-to-one relationship between Sales_Region and Region_Manager.
✑ There are more records in Manager than in Region_Manager, but every record in Region_Manager has a corresponding record in Manager.
✑ There are more records in Sales_Manager than in Sales_Region, but every record in Sales_Region has a corresponding record in Sales_Manager.
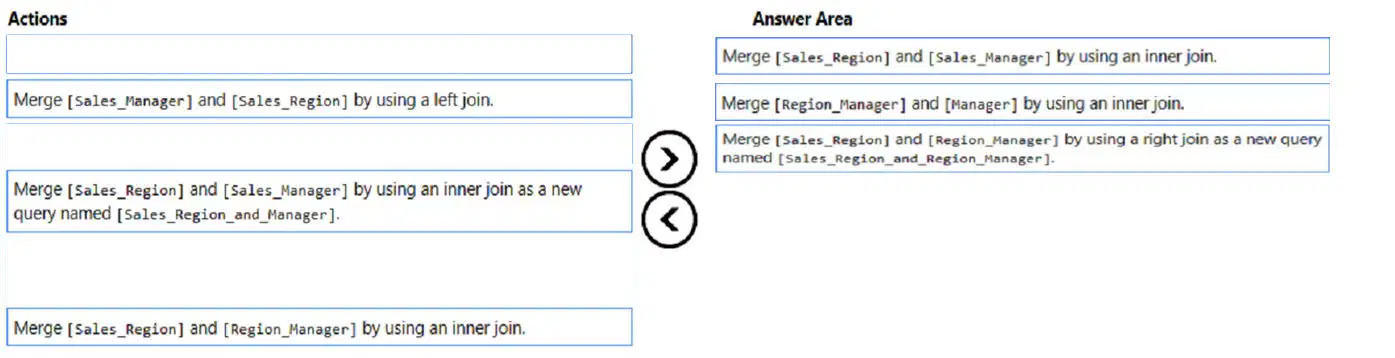
You need to denormalize the model into a single table. Only managers who are associated to a sales region must be included in the reports.
Which three actions should you perform in sequence? To answer, move the appropriate actions from the list of actions to the answer area and arrange them in the correct order.
NOTE: More than one order of answer choices is correct. You will receive credit for any of the correct orders you select.
Select and Place:
You have a Microsoft Power BI report. The size of PBIX file is 550 MB. The report is accessed by using an App workspace in shared capacity of powerbi.com.
The report uses an imported dataset that contains one fact table. The fact table contains 12 million rows. The dataset is scheduled to refresh twice a day at 08:00 and 17:00.
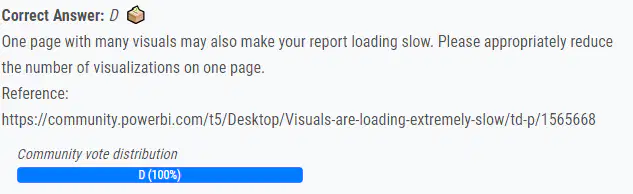
The report is a single page that contains 15 AppSource visuals and 10 default visuals.
Users say that the report is slow to load the visuals when they access and interact with the report.
You need to recommend a solution to improve the performance of the report.
What should you recommend?
Change any DAX measures to use iterator functions.
Enable visual interactions.
Replace the default visuals with AppSource visuals.

HOTSPOT -
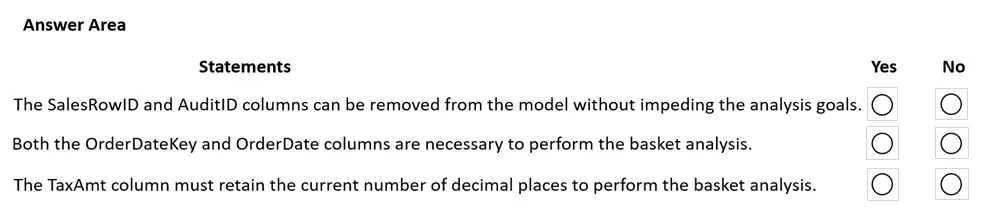
You are creating a Microsoft Power BI imported data model to perform basket analysis. The goal of the analysis is to identify which products are usually bought together in the same transaction across and within sales territories.
You import a fact table named Sales as shown in the exhibit. (Click the Exhibit tab.)
The related dimension tables are imported into the model.
Sales contains the data shown in the following table.
You are evaluating how to optimize the model.
For each of the following statements, select Yes if the statement is true. Otherwise, select No.
NOTE: Each correct selection is worth one point.
Hot Area:


You have a Microsoft Power BI data model that contains three tables named Orders, Date, and City. There is a one-to-many relationship between Date and
Orders and between City and Orders.
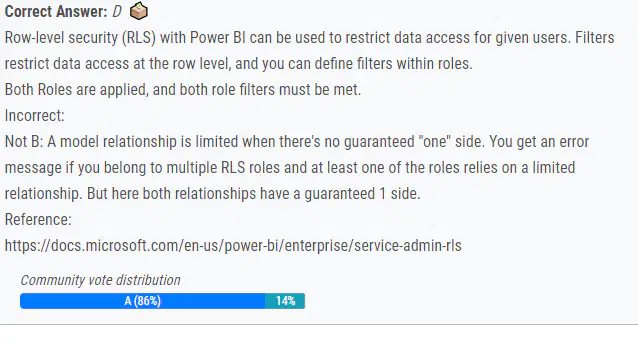
The model contains two row-level security (RLS) roles named Role1 and Role2. Role1 contains the following filter.
City[State Province] = "Kentucky"
Role2 contains the following filter.
Date[Calendar Year] = 2020 -
If a user is a member of both Role1 and Role2, what data will they see in a report that uses the model?
The user will see data for which the State Province value is Kentucky or where the Calendar Year is 2020.
The user will receive an error and will not be able to see the data in the report.
The user will only see data for which the State Province value is Kentucky
The user will only see data for which the State Province value is Kentucky and the Calendar Year is 2020.
Note: This question is part of a series of questions that present the same scenario. Each question in the series contains a unique solution that might meet the stated goals. Some question sets might have more than one correct solution, while others might not have a correct solution.
After you answer a question in this section, you will NOT be able to return to it. As a result, these questions will not appear in the review screen.
You are modeling data by using Microsoft Power BI. Part of the data model is a large Microsoft SQL Server table named Order that has more than 100 million records.
During the development process, you need to import a sample of the data from the Order table.
Solution: From Power Query Editor, you import the table and then add a filter step to the query.
Does this meet the goal?
Yes

No

You are modeling data by using Microsoft Power BI. Part of the data model is a large Microsoft SQL Server table named Order that has more than 100 million records.
During the development process, you need to import a sample of the data from the Order table.
Solution: You write a DAX expression that uses the FILTER function.
Does this meet the goal?
Note: This question is part of a series of questions that present the same scenario. Each question in the series contains a unique solution that might meet the stated goals. Some question sets might have more than one correct solution, while others might not have a correct solution.
After you answer a question in this section, you will NOT be able to return to it. As a result, these questions will not appear in the review screen.
Yes
No
Note: This question is part of a series of questions that present the same scenario. Each question in the series contains a unique solution that might meet the stated goals. Some question sets might have more than one correct solution, while others might not have a correct solution.
After you answer a question in this section, you will NOT be able to return to it. As a result, these questions will not appear in the review screen.
You are modeling data by using Microsoft Power BI. Part of the data model is a large Microsoft SQL Server table named Order that has more than 100 million records.
During the development process, you need to import a sample of the data from the Order table.
Solution: You add a WHERE clause to the SQL statement.
Does this meet the goal?

Yes
No

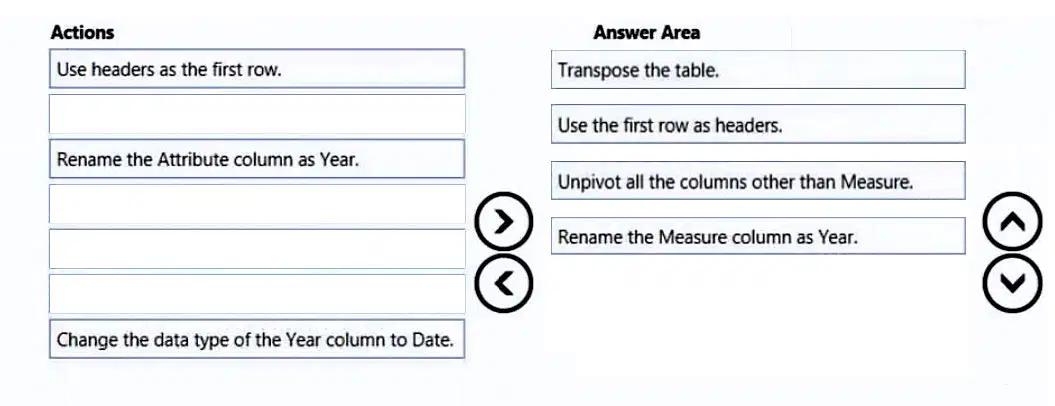
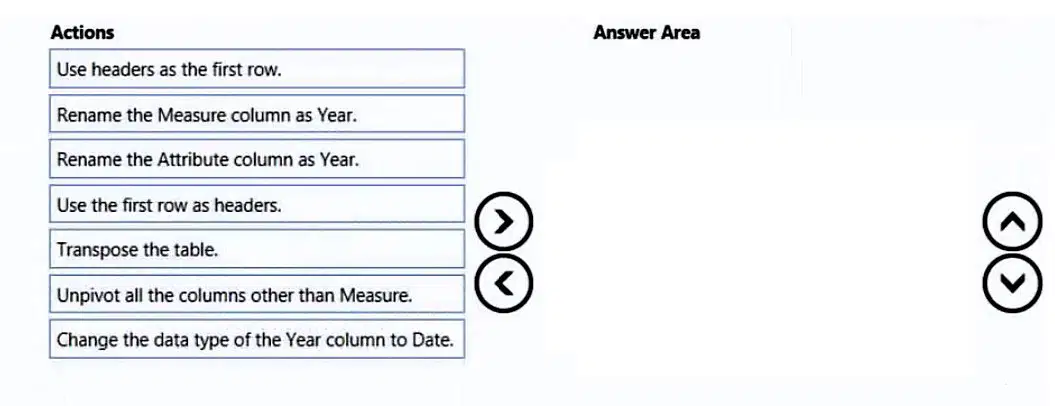
DRAG DROP -
You are preparing a financial report in Power BI.
You connect to the data stored in a Microsoft Excel spreadsheet by using Power Query Editor as shown in the following exhibit.
You need to prepare the data to support the following:
✑ Visualizations that include all measures in the data over time
✑ Year-over-year calculations for all the measures
Which four actions should you perform in sequence? To answer, move the appropriate actions from the list of actions to the answer area and arrange them in the correct order.
Select and Place:
Q
HOTSPOT -
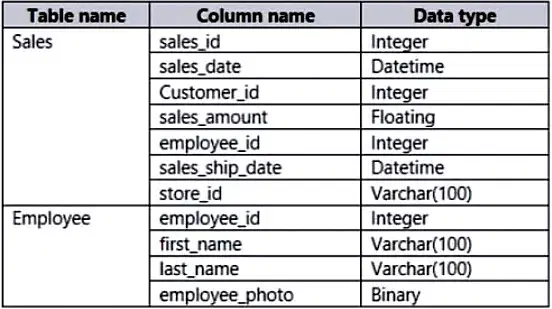
You are creating an analytics report that will consume data from the tables shown in the following table.
There is a relationship between the tables.
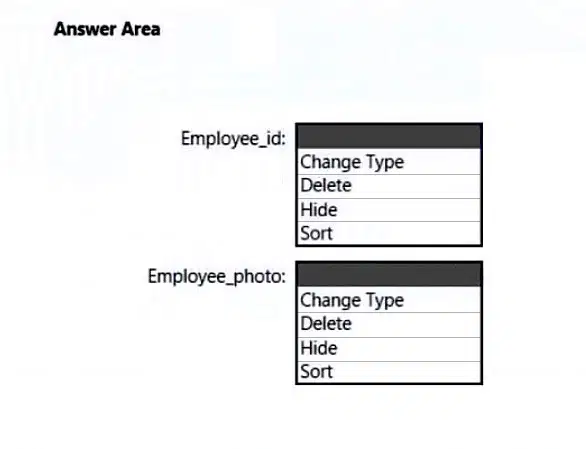
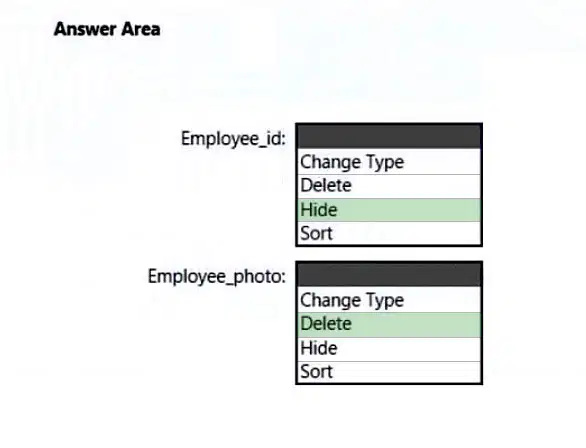
There are no reporting requirements on employee_id and employee_photo.
You need to optimize the data model.
What should you configure for employee_id and employee_photo? To answer, select the appropriate options in the answer area.
NOTE: Each correct selection is worth one point.
Hot Area:
HOTSPOT -
You plan to create Power BI dataset to analyze attendance at a school. Data will come from two separate views named View1 and View2 in an Azure SQL database.
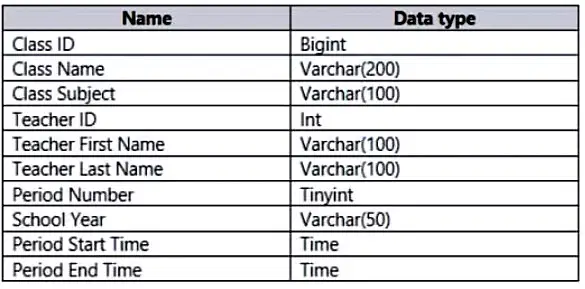
View1 contains the columns shown in the following table.
View2 contains the columns shown in the following table.
The views can be related based on the Class ID column.
Class ID is the unique identifier for the specified class, period, teacher, and school year. For example, the same class can be taught by the same teacher during two different periods, but the class will have a different class ID.
You need to design a star schema data model by using the data in both views. The solution must facilitate the following analysis:
✑ The count of classes that occur by period
✑ The count of students in attendance by period by day
✑ The average number of students attending a class each month
In which table should you include the Teacher First Name and Period Number fields? To answer, select the appropriate options in the answer area.
NOTE: Each correct selection is worth one point.
Hot Area:


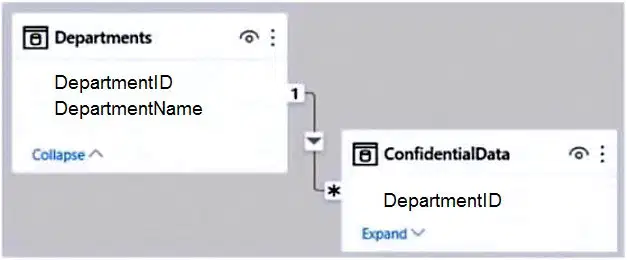
You have the Power BI model shown in the following exhibit.
There are four departments in the Departments table.
You need to ensure that users can see the data of their respective department only.
What should you do?
Create a slicer that filters Departments based on DepartmentID.

Create a row-level security (RLS) role for each department, and then define the membership of the role.
Create a DepartmentID parameter to filter the Departments table.
To the ConfidentialData table, add a calculated measure that uses the CURRENTGROUP DAX function.
In Power BI Desktop, you are building a sales report that contains two tables. Both tables have row-level security (RLS) configured.
You need to create a relationship between the tables. The solution must ensure that bidirectional cross-filtering honors the RLS settings.
What should you do?
Create an inactive relationship between the tables and select Apply security filter in both directions.
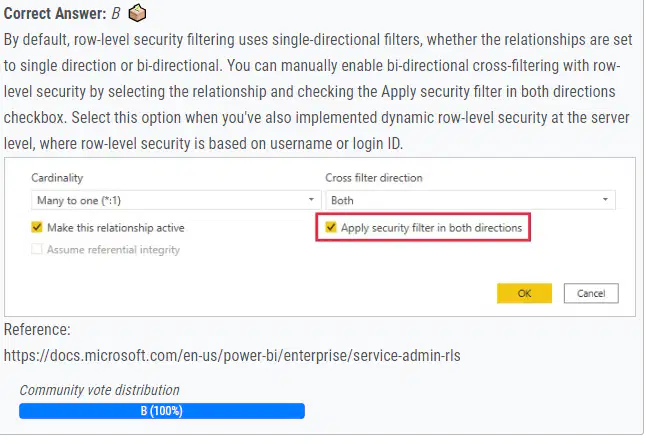
Create an active relationship between the tables and select Apply security filter in both directions.
Create an inactive relationship between the tables and select Assume referential integrity.
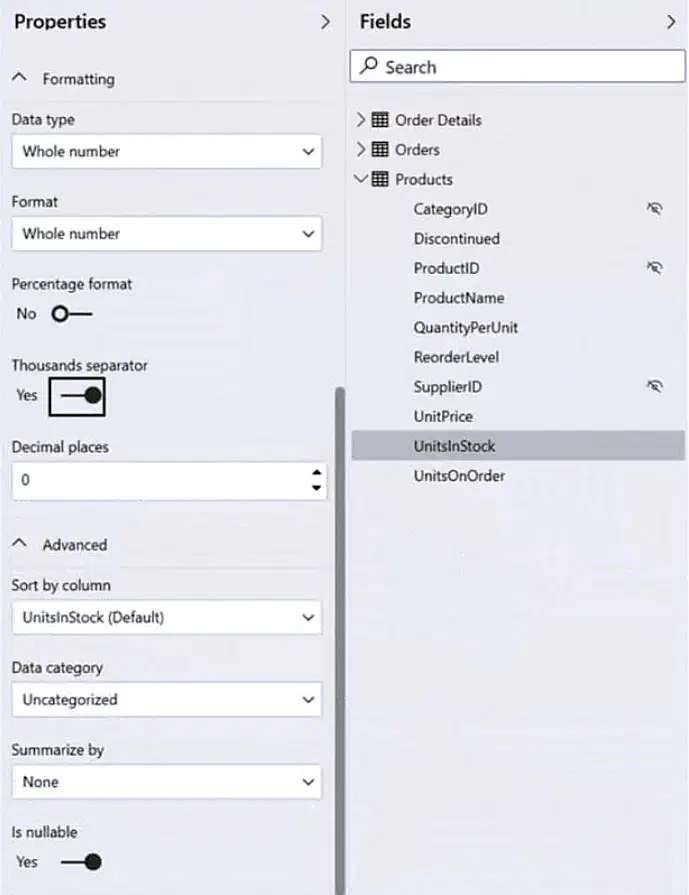
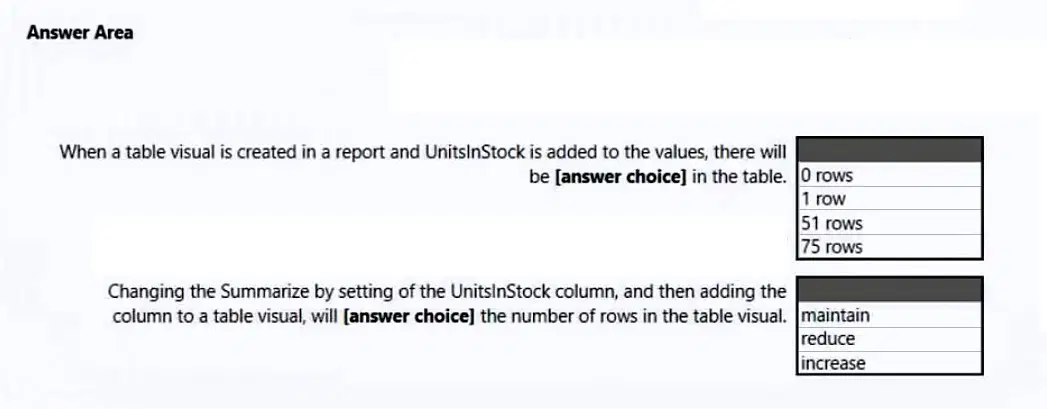
HOTSPOT -
You have a column named UnitsInStock as shown in the following exhibit.
UnitsInStock has 75 non-null values, of which 51 are unique.
Use the drop-down menus to select the answer choice that completes each statement based on the information presented in the graphic.
NOTE: Each correct selection is worth one point.
Hot Area:


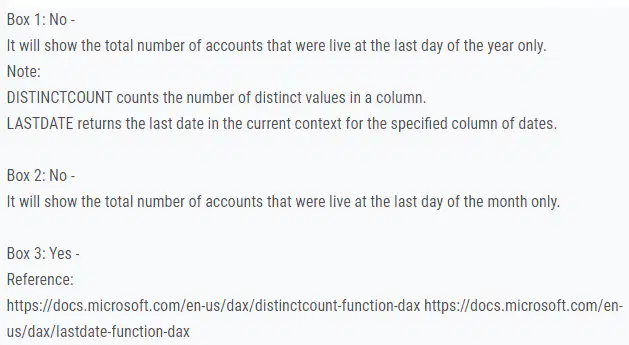
HOTSPOT -
You have a Power BI report.
You have the following tables.
You have the following DAX measure.
Accounts :=
CALCULATE (
DISTINCTCOUNT (Balances[AccountID]),
LASTDATE ('Date'[Date])
For each of the following statements, select Yes if the statement is true. Otherwise, select No.
NOTE: Each correct selection is worth one point.
Hot Area:


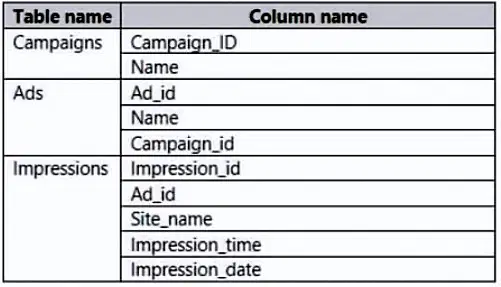
You have the tables shown in the following table.
The Impressions table contains approximately 30 million records per month.
You need to create an ad analytics system to meet the following requirements:
✑ Present ad impression counts for the day, campaign, and site_name. The analytics for the last year are required.
Minimize the data model size.
Which two actions should you perform? Each correct answer presents part of the solution.
NOTE: Each correct selection is worth one point.
Create one-to-many relationships between the tables.
Group the Impressions query in Power Query by Ad_id, Site_name, and Impression_date. Aggregate by using the CountRows function.

Create a calculated table that contains Ad_id, Site_name, and Impression_date.
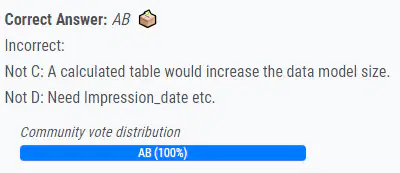
Create a calculated measure that aggregates by using the COUNTROWS function.
HOTSPOT -
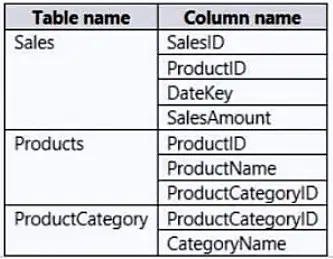
You are creating a Microsoft Power BI data model that has the tables shown in the following table.
The Products table is related to the ProductCategory table through the ProductCategoryID column. Each product has one product category.
You need to ensure that you can analyze sales by product category.
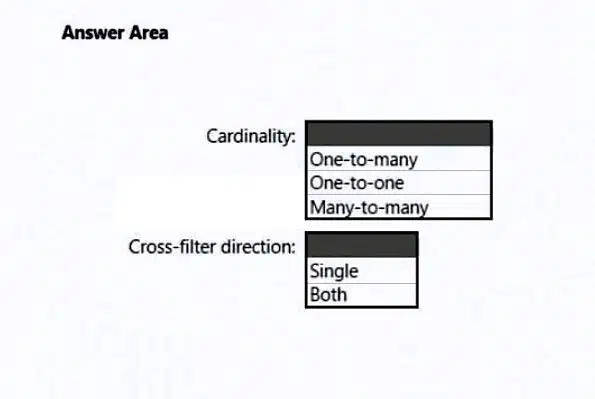
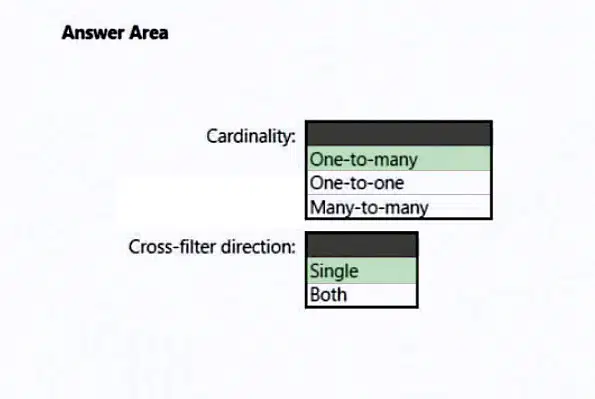
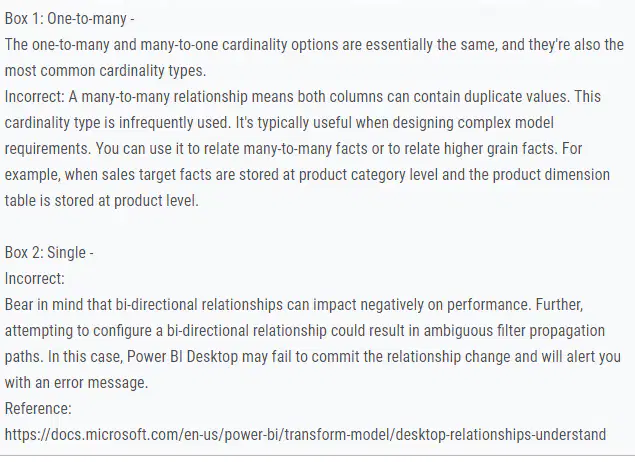
How should you configure the relationship from ProductCategory to Products? To answer, select the appropriate options in the answer area.
NOTE: Each correct selection is worth one point.
Hot Area:
You import a Power BI dataset that contains the following tables:
✑ Date
✑ Product
✑ Product Inventory
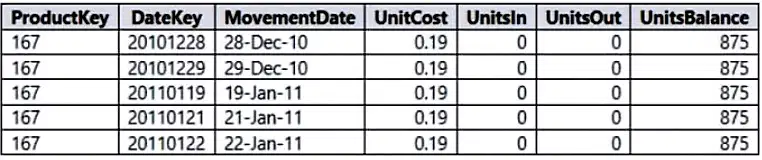
The Product Inventory table contains 25 million rows. A sample of the data is shown in the following table.
The Product Inventory table relates to the Date table by using the DateKey column. The Product Inventory table relates to the Product table by using the
ProductKey column.
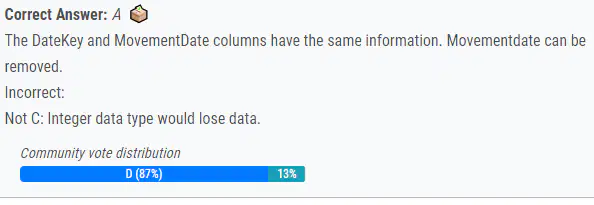
You need to reduce the size of the data model without losing information.
What should you do?
Change Summarization for DateKey to Don't Summarize.
Remove the relationship between Date and Product Inventory
Change the data type of UnitCost to Integer.
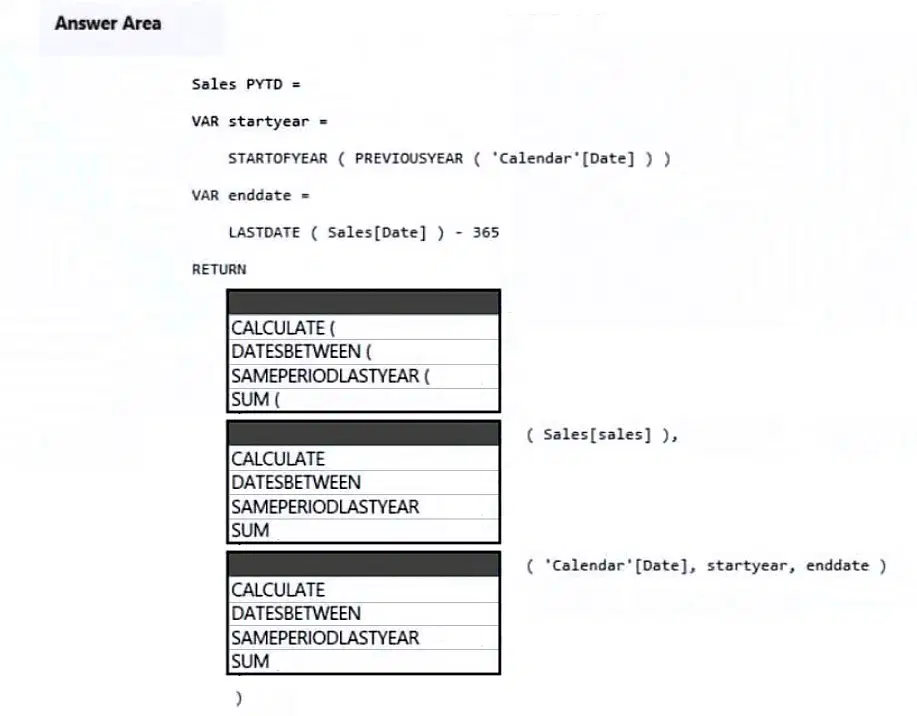
HOTSPOT -
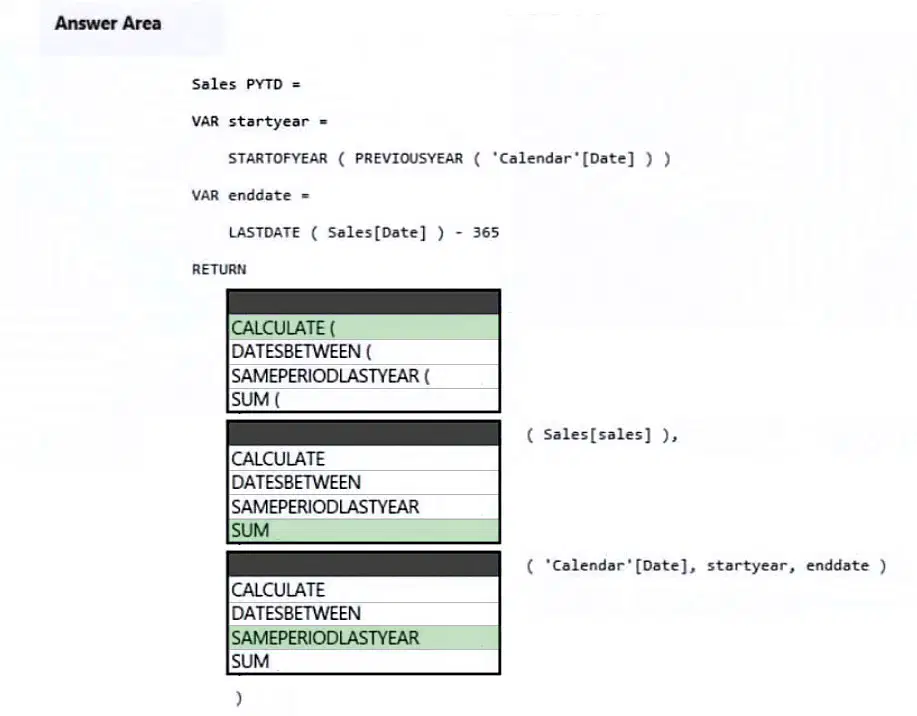
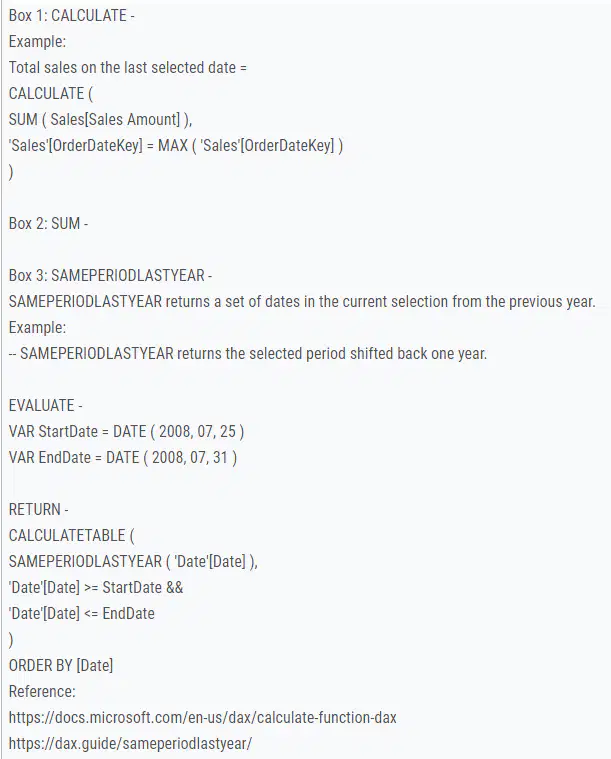
You are enhancing a Power BI model that has DAX calculations.
You need to create a measure that returns the year-to-date total sales from the same date of the previous calendar year.
Which DAX functions should you use? To answer, select the appropriate options in the answer area.
NOTE: Each correct selection is worth one point.
Hot Area:
Note: This question is part of a series of questions that present the same scenario. Each question in the series contains a unique solution that might meet the stated goals. Some question sets might have more than one correct solution, while others might not have a correct solution.
After you answer a question in this section, you will NOT be able to return to it. As a result, these questions will not appear in the review screen.
You are modeling data by using Microsoft Power BI. Part of the data model is a large Microsoft SQL Server table named Order that has more than 100 million records.
During the development process, you need to import a sample of the data from the Order table.
Solution: You add a report-level filter that filters based on the order date.
Does this meet the goal?
Yes

Note: This question is part of a series of questions that present the same scenario. Each question in the series contains a unique solution that might meet the stated goals. Some question sets might have more than one correct solution, while others might not have a correct solution.
After you answer a question in this section, you will NOT be able to return to it. As a result, these questions will not appear in the review screen.
You have a Power BI report that imports a date table and a sales table from an Azure SQL database data source. The sales table has the following date foreign keys:
✑ Due Date
✑ Order Date
✑ Delivery Date
You need to support the analysis of sales over time based on all the date foreign keys.
Solution: For each date foreign key, you add inactive relationships between the sales table and the date table.
Does this meet the goal?
Yes

Note: This question is part of a series of questions that present the same scenario. Each question in the series contains a unique solution that might meet the stated goals. Some question sets might have more than one correct solution, while others might not have a correct solution.
After you answer a question in this section, you will NOT be able to return to it. As a result, these questions will not appear in the review screen.
You have a Power BI report that imports a date table and a sales table from an Azure SQL database data source. The sales table has the following date foreign keys:
✑ Due Date
✑ Order Date
✑ Delivery Date
You need to support the analysis of sales over time based on all the date foreign keys.
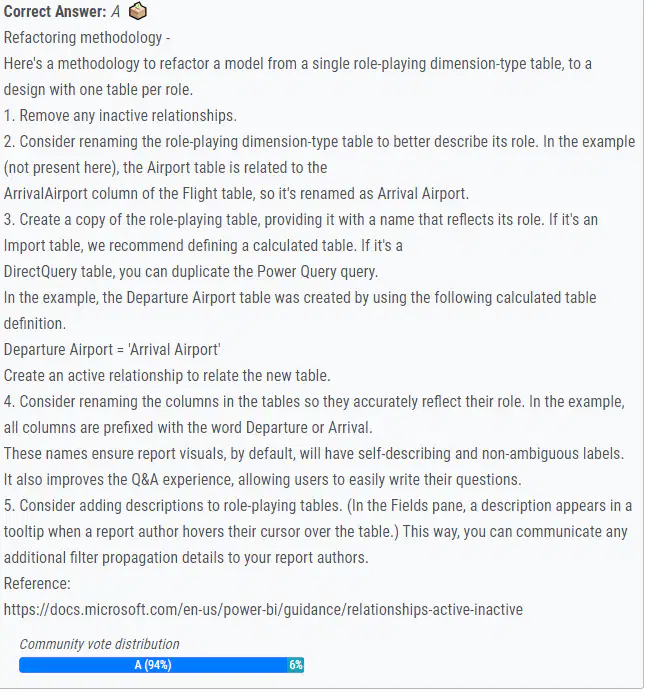
Solution: From Power Query Editor, you rename the date query as Due Date. You reference the Due Date query twice to make the queries for Order Date and
Delivery Date.
Does this meet the goal?
Yes
No
Note: This question is part of a series of questions that present the same scenario. Each question in the series contains a unique solution that might meet the stated goals. Some question sets might have more than one correct solution, while others might not have a correct solution.
After you answer a question in this section, you will NOT be able to return to it. As a result, these questions will not appear in the review screen.
You have a Power BI report that imports a date table and a sales table from an Azure SQL database data source. The sales table has the following date foreign keys:
✑ Due Date
✑ Order Date
✑ Delivery Date
You need to support the analysis of sales over time based on all the date foreign keys.
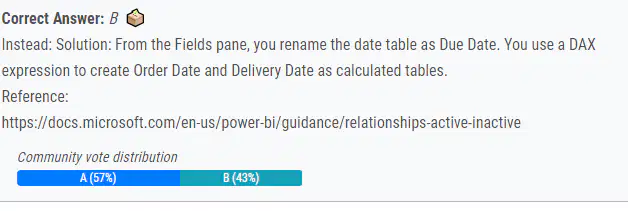
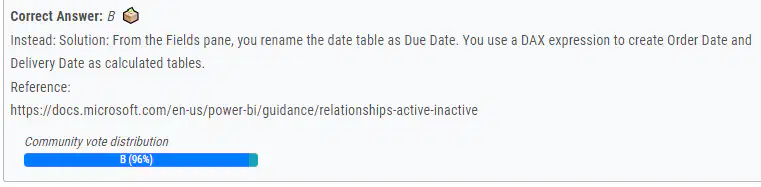
Solution: From the Fields pane, you rename the date table as Due Date. You use a DAX expression to create Order Date and Delivery Date as calculated tables.
Does this meet the goal?
Yes
No
DRAG DROP -
You receive revenue data that must be included in Microsoft Power BI reports.
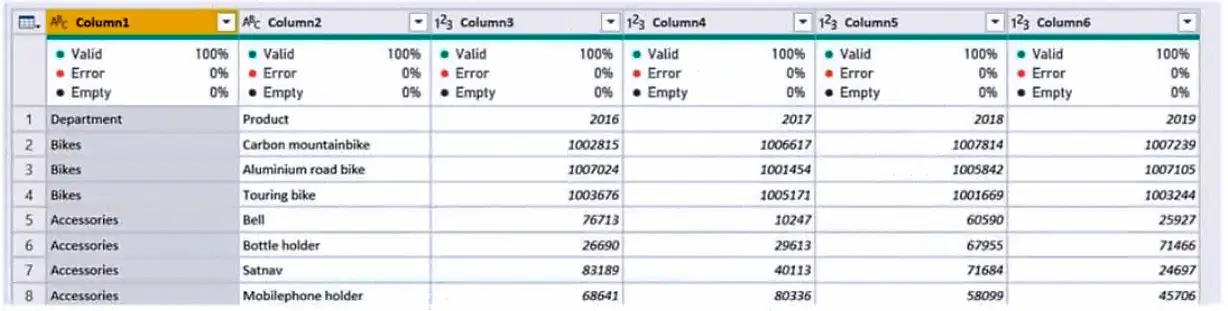
You preview the data from a Microsoft Excel source in Power Query as shown in the following exhibit.
You plan to create several visuals from the data, including a visual that shows revenue split by year and product.
You need to transform the data to ensure that you can build the visuals. The solution must ensure that the columns are named appropriately for the data that they contain.
Which three actions should you perform in sequence? To answer, move the appropriate actions from the list of actions to the answer area and arrange them in the correct order.
Select and Place:


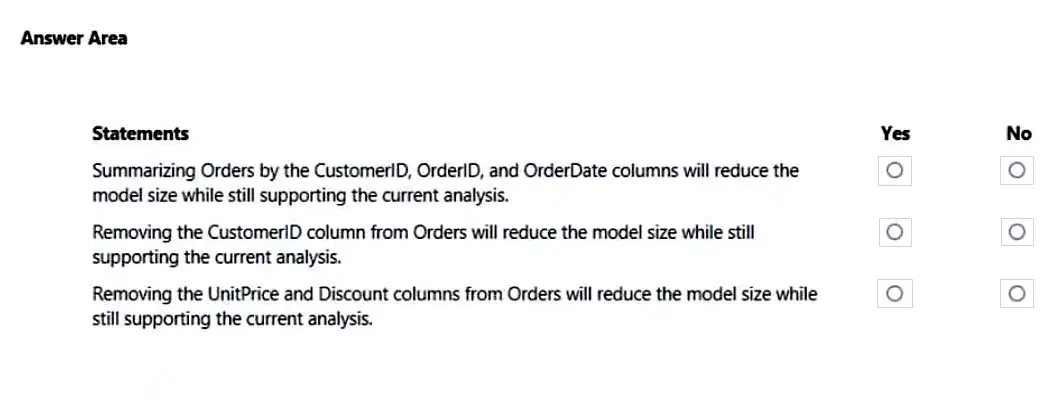
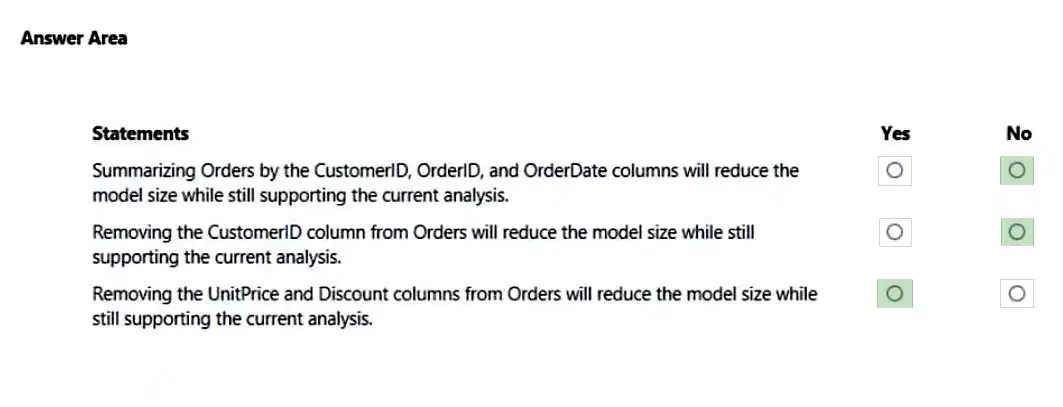
HOTSPOT -
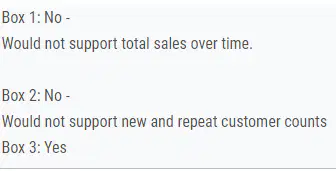
You have a Power BI report named Orders that supports the following analysis:
✑ Total sales over time
✑ The count of orders over time
✑ New and repeat customer counts
The data model size is nearing the limit for a dataset in shared capacity.
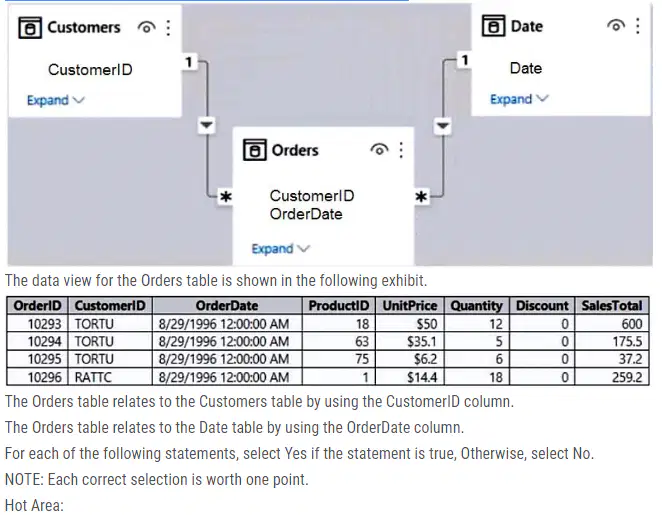
The model view for the dataset is shown in the following exhibit.
HOTSPOT -
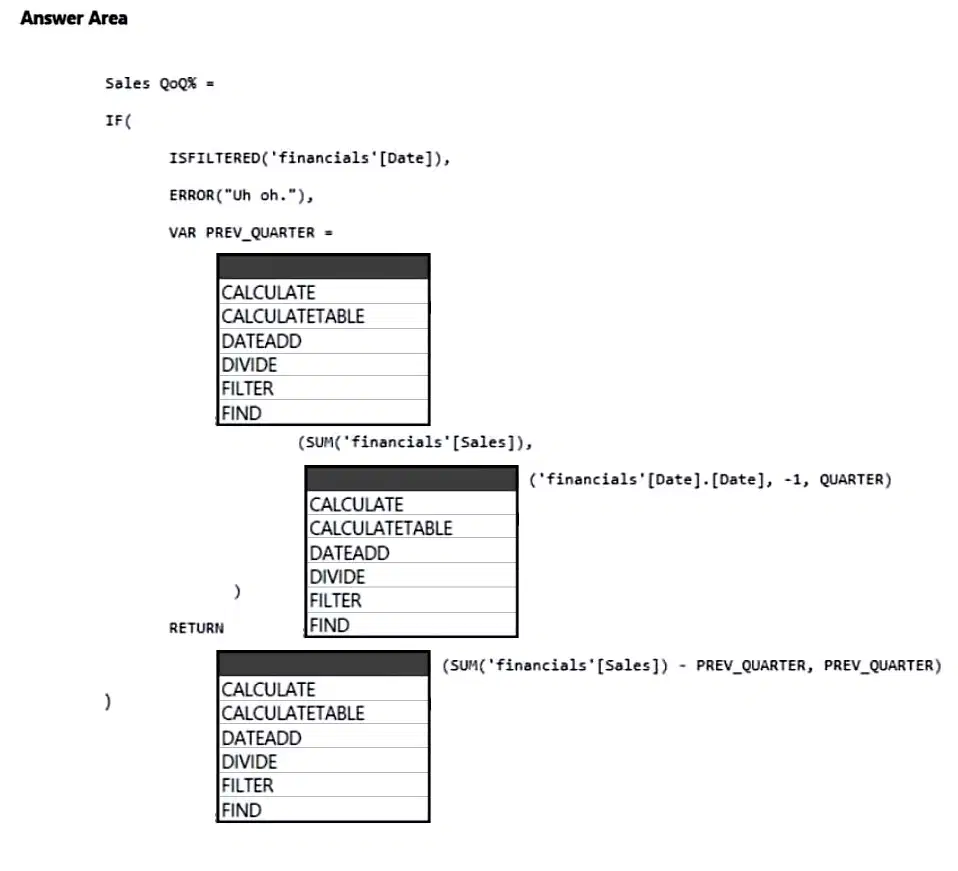
You are building a financial report by using Power BI.
You have a table named financials that contains a column named Date and a column named Sales.
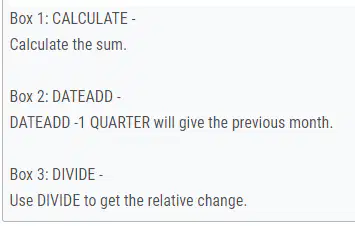
You need to create a measure that calculates the relative change in sales as compared to the previous quarter.
How should you complete the measure? To answer, select the appropriate options in the answer area.
NOTE: Each correct selection is worth one point.
Hot Area:

DRAG DROP -
You are creating a Power BI model and report.
You have a single table in a data model named Product. Product contains the following fields:
✑ ID
✑ Name
✑ Color
✑ Category
✑ Total Sales
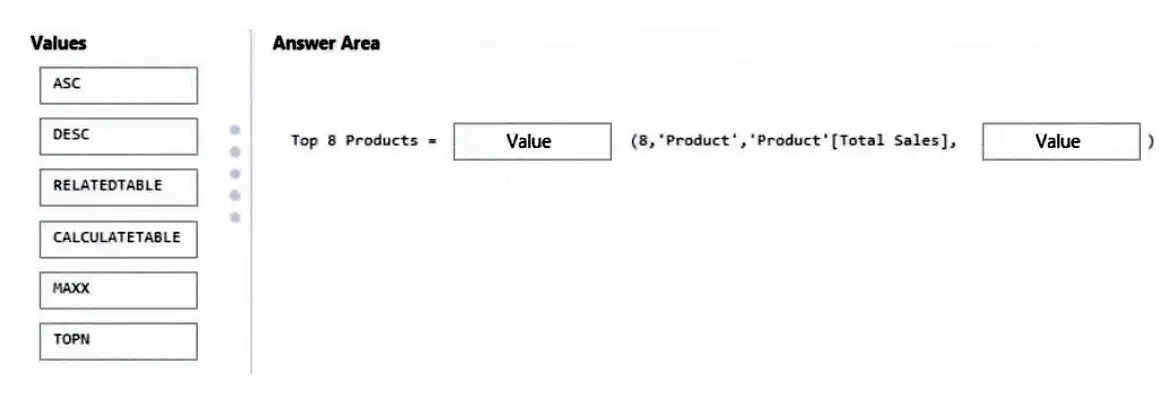
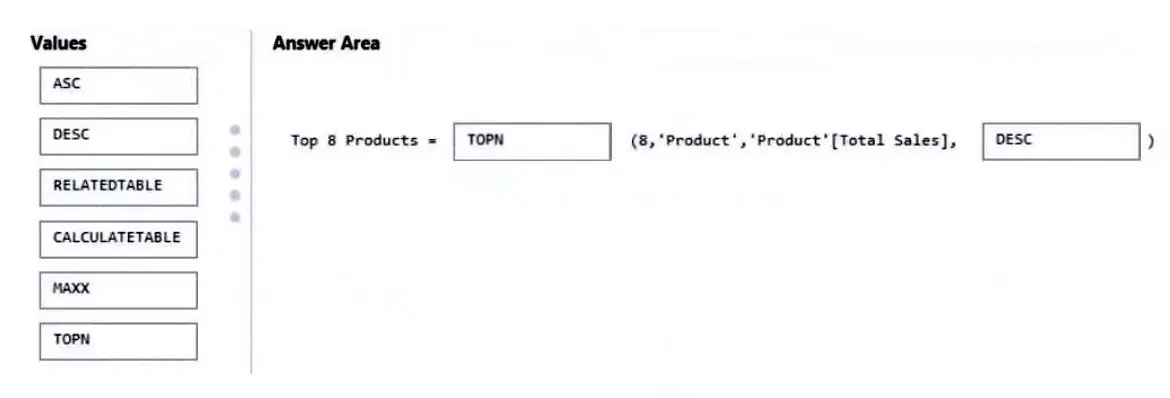
You need to create a calculated table that shows only the top eight products based on the highest value in Total Sales.
How should you complete the DAX expression? To answer, drag the appropriate values to the correct targets. Each value may be used once, more than once, or not at all. You may need to drag the split bar between panes or scroll to view content.
Select and Place:


You are creating a sales report in Power BI for the NorthWest region sales territory of your company. Data will come from a view in a Microsoft SQL Server database. A sample of the data is shown in the following table:
The report will facilitate the following analysis:
✑ The count of orders and the sum of total sales by Order Date
✑ The count of customers who placed an order
✑ The average quantity per order
You need to reduce data refresh times and report query times.
Which two actions should you perform? Each correct answer presents part of the solution.
NOTE: Each correct selection is worth one point.
Set the data type for SalesOrderNumber to Decimal Number.
Remove the CustomerKey and ProductKey columns.
Remove the TaxAmt and Freight columns.
Filter the data to only the NorthWest region sales territory.

You are creating a Power BI model that contains a table named Store. Store contains the following fields.
You plan to create a map visual that will show store locations and provide the ability to drill down from Country to State/Province to City.
What should you do to ensure that the locations are mapped properly?
Change the data type of City, State/Province, and Country.
Set Summarization for City, State/Province, and Country to Don't summarize.

Set the data category of City, State/Province, and Country.
Create a calculated column that concatenates the values in City, State/Province, and Country.
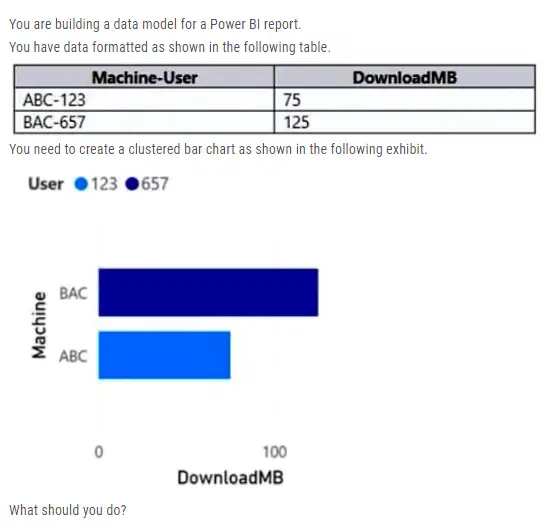
What should you do?
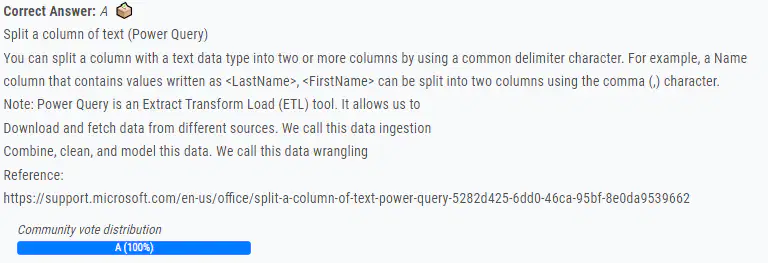
From Power Query Editor, split the Machine-User column by using a delimiter.
From Power Query Editor, create a column that contains the last three digits of the Machine-User column.
In a DAX function, create two calculated columns named Machine and User by using the SUBSTITUTE function.
In a DAX function, create two measures named Machine and User by using the SUBSTITUTE function.

DRAG DROP -
You need create a date table in Power BI that must contain 10 full calendar years, including the current year.
How should you complete the DAX expression? To answer, select the appropriate options in the answer area.
NOTE: Each correct selection is worth one point.
Select and Place:
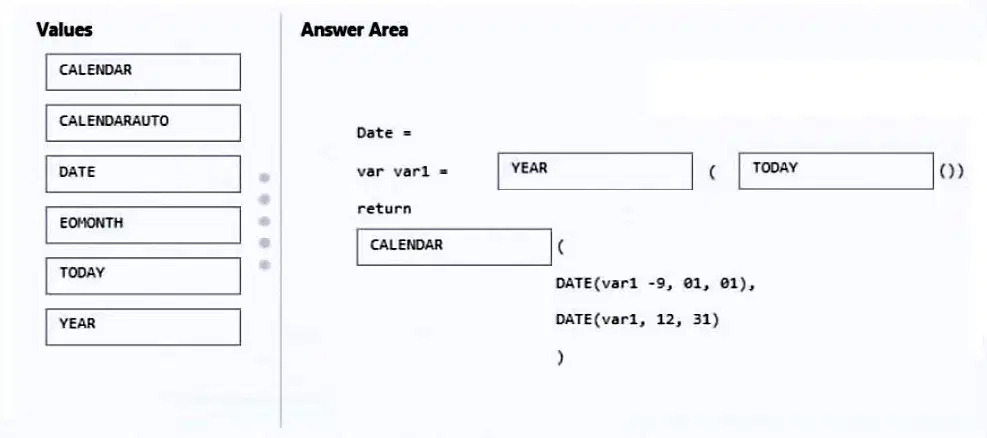
Box 1: YEAR -
Get the current year.
Box 2: TODAY -
TODAY returns the current date.
Box 3: CALENDAR -
CALENDAR returns a table with a single column named ג€Dateג€ containing a contiguous set of dates. The range of dates is from the specified start date to the specified end date, inclusive of those two dates.
The following formula returns a table with dates between January 1st, 2005 and December 31st, 2015.
CALENDAR (
DATE ( 2005, 1, 1 ),
DATE ( 2015, 12, 31 )
Note: This question is part of a series of questions that present the same scenario. Each question in the series contains a unique solution that might meet the stated goals. Some question sets might have more than one correct solution, while others might not have a correct solution.
After you answer a question in this section, you will NOT be able to return to it. As a result, these questions will not appear in the review screen.
You have a Power BI report that imports a date table and a sales table from an Azure SQL database data source. The sales table has the following date foreign keys:
✑ Due Date
✑ Order Date
✑ Delivery Date
You need to support the analysis of sales over time based on all the date foreign keys.
Solution: You create measures that use the USERELATIONSHIP DAX function to filter sales on the active relationship between the sales table and the date table.
Does this meet the goal?
Yes
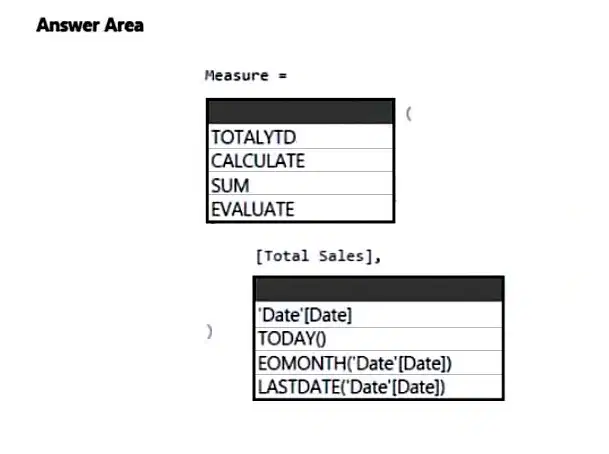
HOTSPOT -
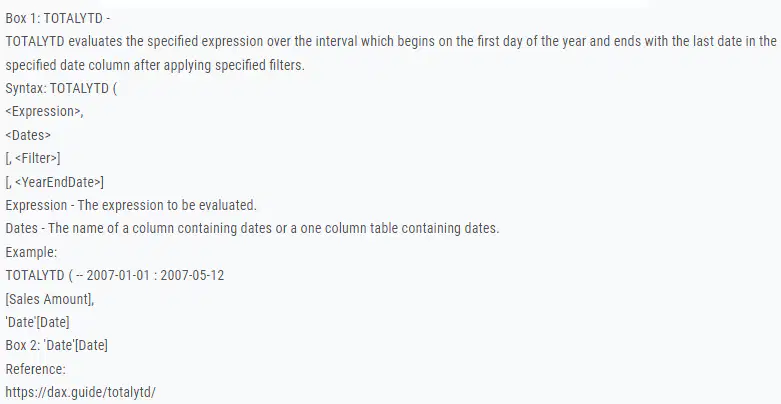
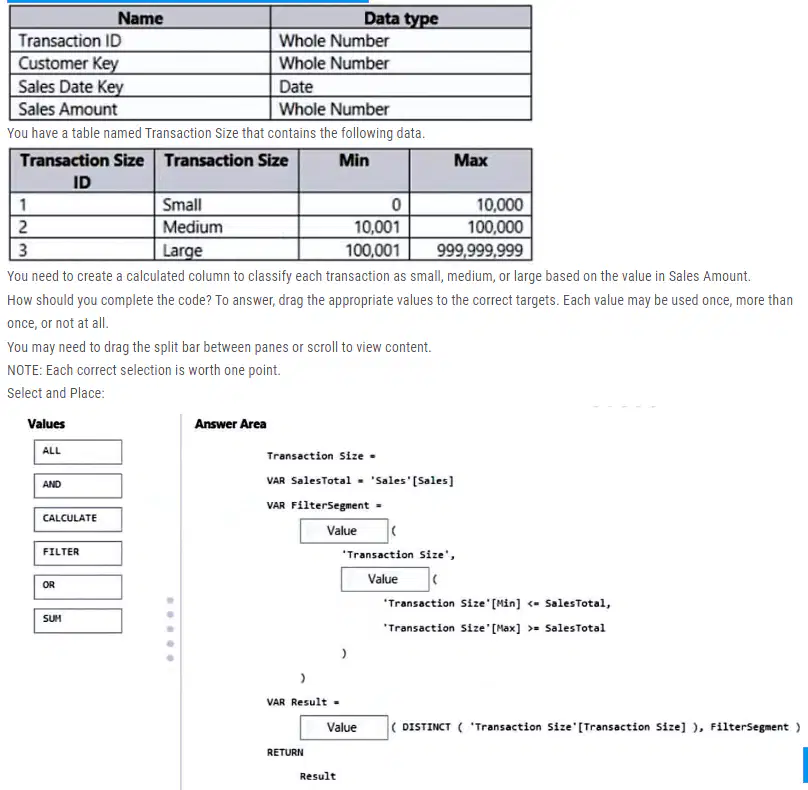
You have a Power BI report that contains a measure named Total Sales.
You need to create a new measure that will return the sum of Total Sales for a year up to a selected date.
How should you complete the DAX expression? To answer, select the appropriate options in the answer area.
NOTE: Each correct selection is worth one point.
Hot Area:

DRAG DROP -
You are modifying a Power BI model by using Power BI Desktop.
You have a table named Sales that contains the following fields.
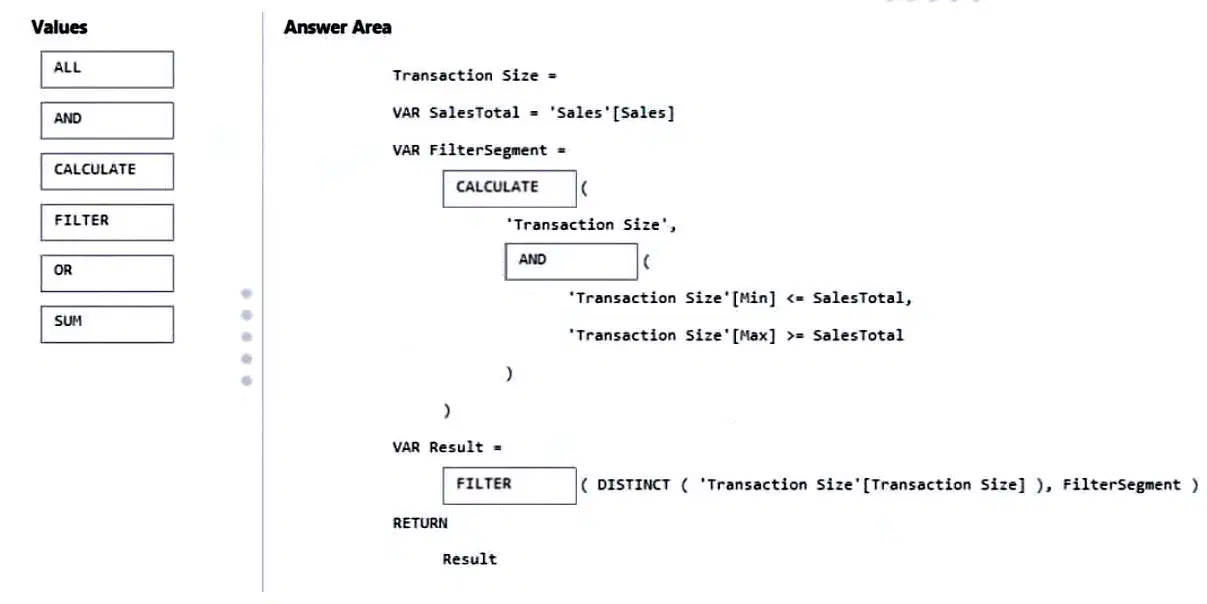
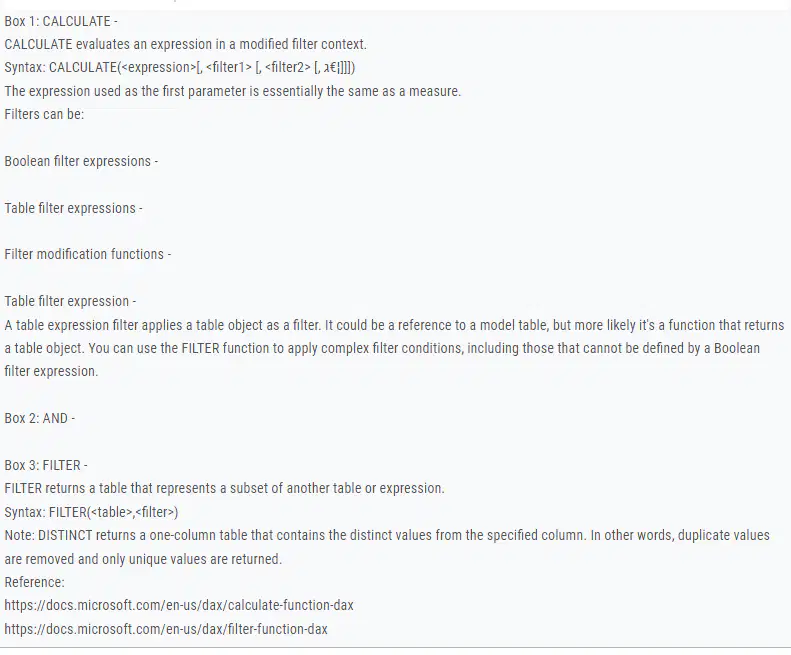
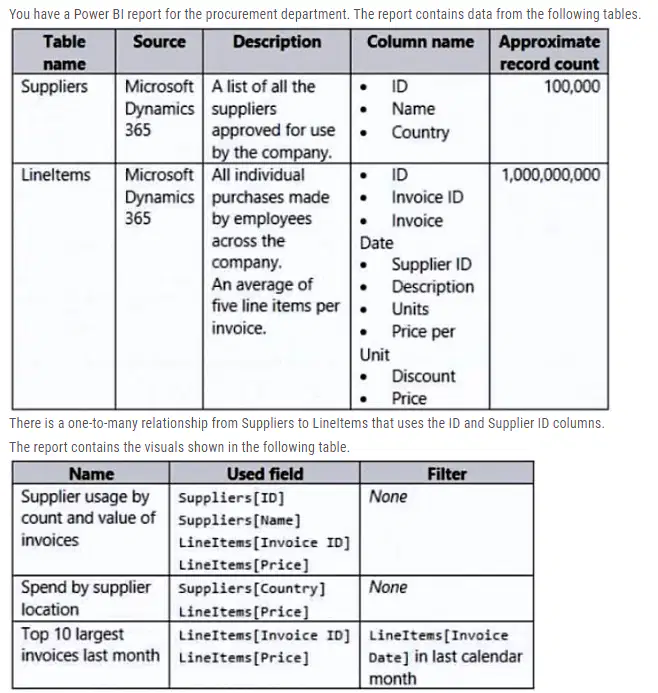
You need to minimize the size of the dataset without affecting the visuals.
What should you do?
Merge Suppliers and LineItems.
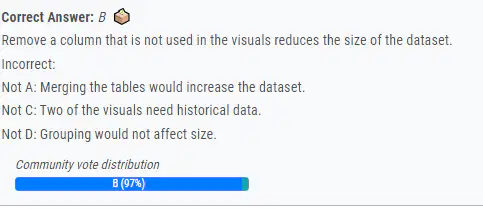
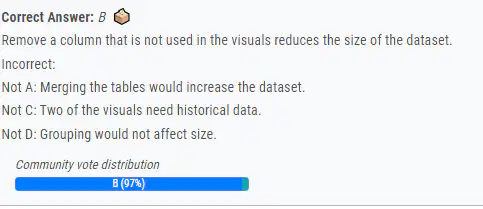
Remove the LineItems[Description] column.
Remove the rows from LineItems where LineItems[Invoice Date] is before the beginning of last month.
Group LineItems by LineItems[Invoice ID] and LineItems[Invoice Date] with a sum of LineItems[Price].
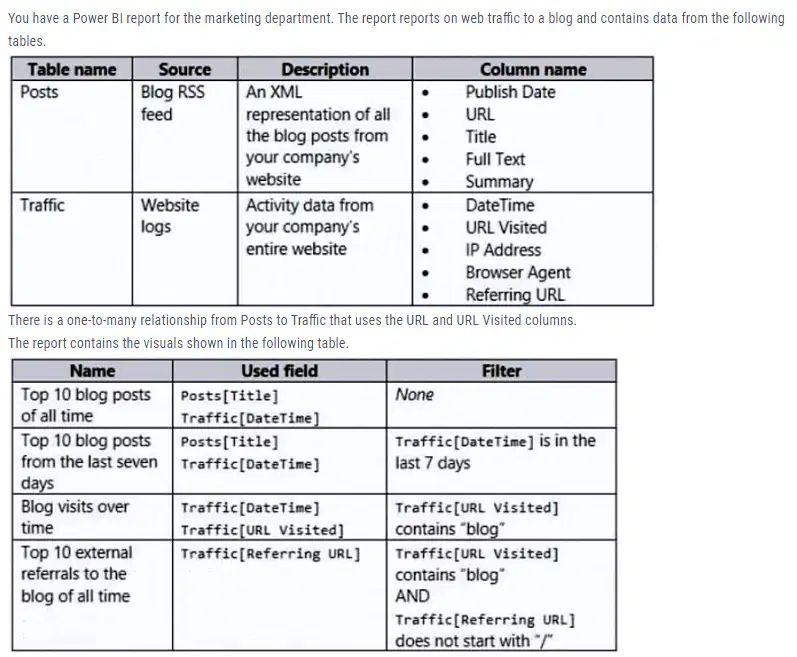
The dataset takes a long time to refresh.
You need to modify Posts and Traffic queries to reduce load times.
Which two actions will reduce the load times? Each correct answer presents part of the solution.
NOTE:
Each correct selection is worth one point.
Remove the rows in Posts in which Posts[Publish Date] is in the last seven days.
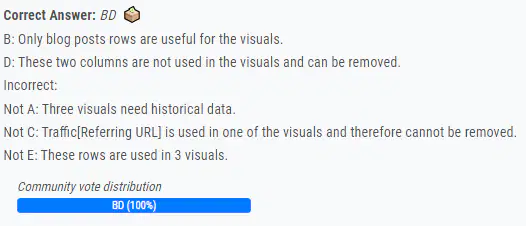
Remove the rows in Traffic in which Traffic[URL Visited] does not contain ג€blogג€.
Remove Traffic[IP Address], Traffic[Browser Agent], and Traffic[Referring URL].
Remove Posts[Full Text] and Posts[Summary].
Remove the rows in Traffic in which Traffic[Referring URL] does not start with ג€/ג€.

How should you configure the quick measure calculation? To answer, select the appropriate options in the answer area.


Which DAX expression should you use?
Calculate (Sum(Sales[Sales]), PREVIOUSYEAR( dimDate[Date])
TOTALYTD (SUM(Sales[Sales]), dimDate[Date] )
Calculate (SUM(Sales[Sales]), SAMEPERIODLASTYEAR(dimDate[Date] ))
SUM(Sales[Sales])

You use Power BI Desktop to load data from a Microsoft SQL Server database.
While waiting for the data to load, you receive the following error.
You need to resolve the error.
What are two ways to achieve the goal? Each correct answer presents a complete solution.
NOTE: Each correct selection is worth one point.
Reduce the number of rows and columns returned by each query.
Split log running queries into subsets of columns and use Power Query to merge the queries
Use Power Query to combine log running queries into one query.
Disable query folding on long running queries.
Note: This question is part of a series of questions that present the same scenario. Each question in the series contains a unique solution that might meet the stated goals. Some question sets might have more than one correct solution, while others might not have a correct solution.
After you answer a question in this section, you will NOT be able to return to it. As a result, these questions will not appear in the review screen.
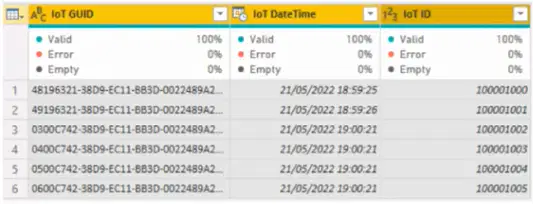
From Power Query Editor, you profile the data shown in the following exhibit.
The IoT GUID and IoT ID columns are unique to each row in the query.
You need to analyze IoT events by the hour and day of the year. The solution must improve dataset performance.
Solution: You split the IoT DateTime column into a column named Date and a column named Time.
Does this meet the goal?
Yes
No

You need to analyze IoT events by the hour and day of the year. The solution must improve dataset performance.
Solution: You remove the IoT GUID column and retain the IoT ID column.
Does this meet the goal?
Yes
No

You need to analyze IoT events by the hour and day of the year. The solution must improve dataset performance.
Solution: You change the IoT DateTime column to the Date data type.
Does this meet the goal?
Yes
No
You have a Microsoft Power BI report. The size of PBIX file is 550 MB. The report is accessed by using an App workspace in shared capacity of powerbi.com.
The report uses an imported dataset that contains one fact table. The fact table contains 12 million rows. The dataset is scheduled to refresh twice a day at 08:00 and 17:00.
The report is a single page that contains 15 AppSource visuals and 10 default visuals.
Users say that the report is slow to load the visuals when they access and interact with the report.
You need to recommend a solution to improve the performance of the report.
What should you recommend?
Change any DAX measures to use iterator functions.
Remove unused columns from tables in the data model.
Replace the default visuals with AppSource visuals.
Increase the number of times that the dataset is refreshed.

DRAG DROP
-
You have a Power BI data model that contains two tables named Products and Sales.
A one-to-many relationship exists between the tables.
You have a report that contains a report-level filter for Products.
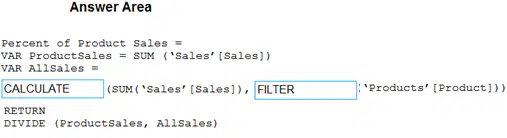
You need to create a measure that will return the percent of total sales for each product. The measure must respect the report-level filter when calculating the total.
How should you complete the DAX measure? To answer, drag the appropriate DAX functions to the correct targets. Each function may be used once, more than once, or not at all. You may need to drag the split bar between panes or scroll to view content.
NOTE: Each correct selection is worth one point.
Q

You have a Power BI data model that analyzes product sales over time. The data model contains the following tables.
A one-to-many relationship exists between the tables.
The auto date/time option for the data model is enabled.
You need to reduce the size of the data model while maintaining the ability to analyze product sales by month and quarter.
Which two actions should you perform? Each correct answer presents part of the solution.
NOTE: Each correct answer is worth one point.
Create a relationship between the Date table and the Sales table.
Disable the auto date/time option.
Create a Date table and select Mark as Date Table.
Disable the load on the Date table.
Remove the relationship between the Product table and the Sales table.
You have a Microsoft Power BI report. The size of PBIX file is 550 MB. The report is accessed by using an App workspace in shared capacity of powerbi.com.
The report uses an imported dataset that contains one fact table. The fact table contains 12 million rows. The dataset is scheduled to refresh twice a day at 08:00 and 17:00.
The report is a single page that contains 15 AppSource visuals and 10 default visuals.
Users say that the report is slow to load the visuals when they access and interact with the report.
You need to recommend a solution to improve the performance of the report.
What should you recommend?
Implement row-level security (RLS).
Remove unused columns from tables in the data model.
Replace the default visuals with AppSource visuals.
Enable visual interactions.

HOTSPOT
-
You have a Power BI data model that contains a table named Stores. The table has the following columns:
• Store Name
• Open Date
• Status
• State
• City
You need to create a calculated column named Active Store Name that meets the following requirements:
• When the value of the Status column is “A”, the value in the Store Name column must be returned.
• When the value of the Status column is NOT “A”, the value in the Store Name column that is prefixed with "Inactive - " must be returned.
How should you complete the DAX expression? To answer, select the appropriate options in the answer area.
NOTE: Each correct selection is worth one point.

b
You have a CSV file that contains user complaints. The file contains a column named Logged. Logged contains the date and time each complaint occurred. The data in Logged is in the following format: 2018-12-31 at 08:59.
You need to be able to analyze the complaints by the logged date and use a built-in date hierarchy.
What should you do?
Apply a transformation to extract the first 11 characters of the logged column.
Add a conditional column that outputs 2018 if the Logged column starts with 2018 and set the data type of the new column to Whole Number.
Create a column by example that starts with 2018-12-31 and set the data type of the new column to Date.
Apply a transformation to extract the last 11 characters of the Logged column and set the data type of the new column to Date.
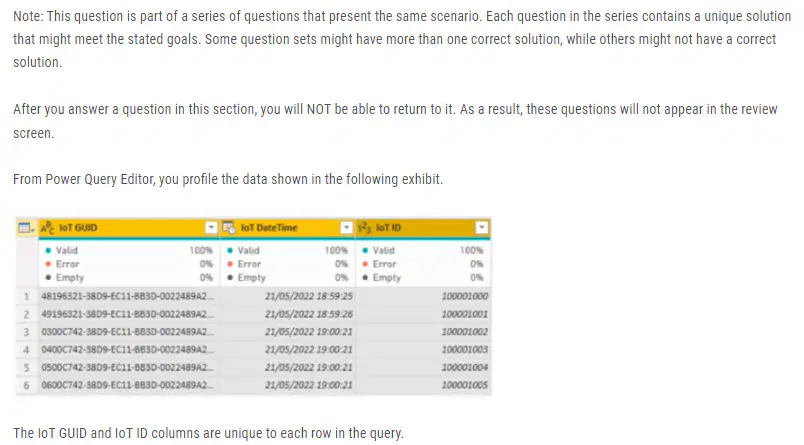
You need to analyze IoT events by the hour and day of the year. The solution must improve dataset performance.
Solution: You create a custom column that concatenates the IoT GUID column and the IoT ID column and then delete the IoT GUID and IoT ID columns.
Does this meet the goal?
Yes
No

You have a Power BI model that contains a table named Employee. The table contains the following data.
Each employee has one manager as shown in the ParentEmployeeID column.
All reporting paths lead to the CEO at the top of the organizational hierarchy.
You need to create a calculated column that returns the count of levels from each employee to the CEO.
Which DAX expression should you use?
PATHLENGTH(PATH(Employee[EmployeeID],Employee[ParentEmployeeID]))
PATHITEM(PATH(Employee[EmployeeID],Employee[ParentEmployeeID]),1,INTEGER)
PATHCONTAINS(PATH(Employee[EmployeeID],Employee[ParentEmployeeID]),1)
PATH(Employee[EmployeeID],Employee[ParentEmployeeID])
You have a Microsoft Power BI report. The size of PBIX file is 550 MB. The report is accessed by using an App workspace in shared capacity of powerbi.com.
The report uses an imported dataset that contains one fact table. The fact table contains 12 million rows. The dataset is scheduled to refresh twice a day at 08:00 and 17:00.
The report is a single page that contains 15 AppSource visuals and 10 default visuals.
Users say that the report is slow to load the visuals when they access and interact with the report.
You need to recommend a solution to improve the performance of the report.
What should you recommend?
Replace the default visuals with AppSource visuals.
Remove unused columns from tables in the data model.
Change the imported dataset to DirectQuery
Increase the number of times that the dataset is refreshed.
You have a CSV file that contains user complaints. The file contains a column named Logged. Logged contains the date and time each complaint occurred. The data in Logged is in the following format: 2018-12-31 at 08:59.
You need to be able to analyze the complaints by the logged date and use a built-in date hierarchy.
What should you do?
Change the data type of the Logged column to Date.
Split the Logged column by using at as the delimiter.
Add a conditional column that outputs 2018 if the Logged column starts with 2018 and set the data type of the new column to Whole Number.
Apply the Parse function from the Date transformations options to the Logged column.

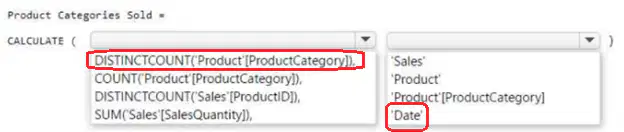
You need to create a measure to count the number of product categories that had products sold during a selected period.
How should you complete the DAX expression? To answer, select the appropriate options in the answer area.

You have a Microsoft Power BI report. The size of PBIX file is 550 MB. The report is accessed by using an App workspace in shared capacity of powerbi.com.
The report uses an imported dataset that contains one fact table. The fact table contains 12 million rows. The dataset is scheduled to refresh twice a day at 08:00 and 17:00.
The report is a single page that contains 15 AppSource visuals and 10 default visuals.
Users say that the report is slow to load the visuals when they access and interact with the report.
You need to recommend a solution to improve the performance of the report.
What should you recommend?
Enable visual interactions.
Change any DAX measures to use iterator functions.
Implement row-level security (RLS).
Remove unused columns from tables in the data model.
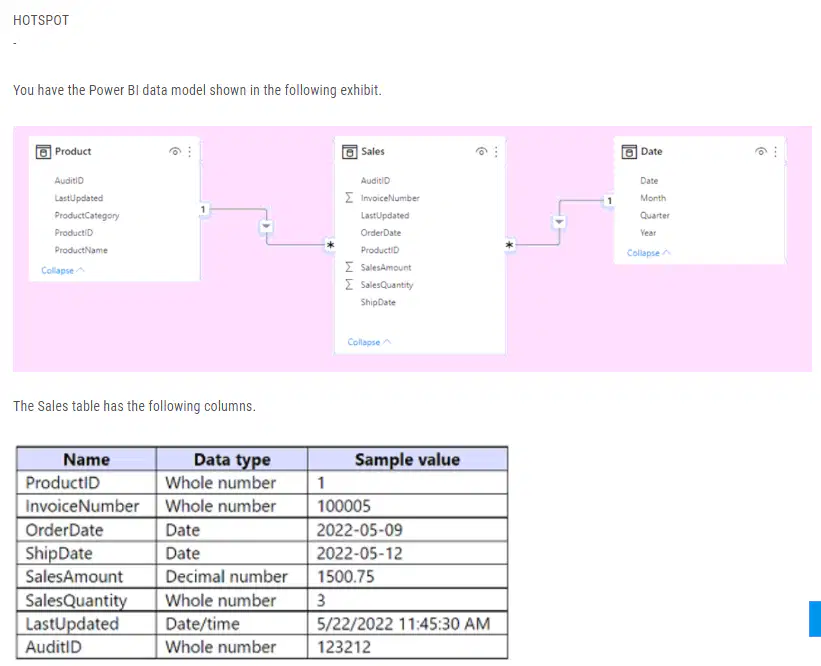
The data model must support the following analysis:
• Total sales by product by month in which the order was placed
• Quantities sold by product by day on which the order was placed
• Number of sales transactions by quarter in which the order was placed
For each of the following statements, select Yes if the statement is true. Otherwise, select No.
NOTE: Each correct selection is worth one point.


You have a CSV file that contains user complaints. The file contains a column named Logged. Logged contains the date and time each complaint occurred. The data in Logged is in the following format: 2018-12-31 at 08:59.
You need to be able to analyze the complaints by the logged date and use a built-in date hierarchy.
What should you do?
Create a column by example that starts with 2018-12-31 and set the data type of the new column to Date
Create a column by example that starts with 2018-12-31
Apply a transformation to extract the last 11 characters of the Logged column
Add a conditional column that outputs 2018 if the Logged column starts with 2018 and set the data type of the new column to Whole Number
You have a Power BI data model that contains a table named Employees. The table has the following columns:
• Employee Name
• Email Address
• Start Date
• Job Title
You are implementing dynamic row-level security (RLS).
You need to create a table filter to meet the following requirements:
• Users must see only their own employee data.
• The DAX expression must work in both Power BI Desktop and the Power BI service.
Which expression should you use?
. [Email Address] - USERNAME()
[Employee Name] - USERPRINCIPALNAME()
[Employee Name] = USERNAME()
[Email Address] = USERPRINCIPALNAME()
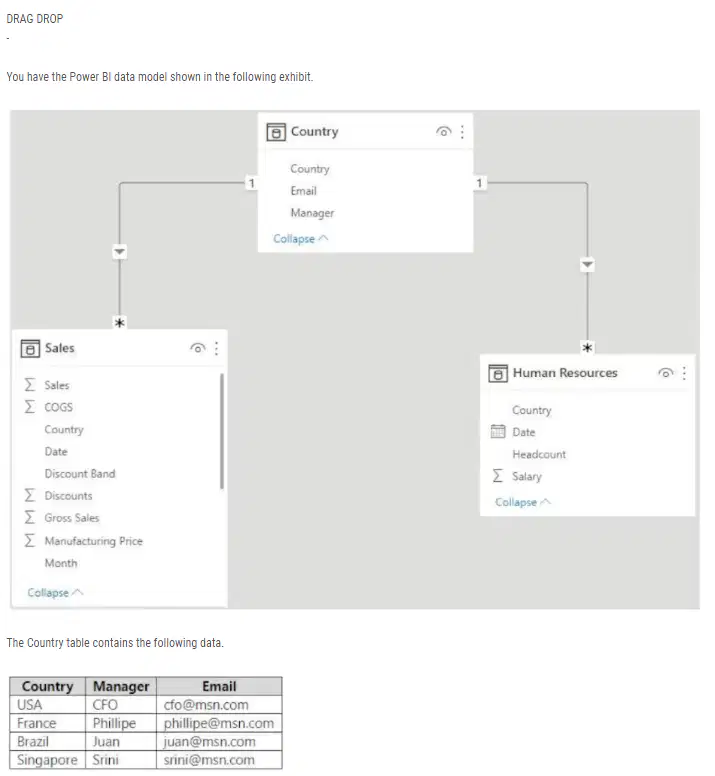
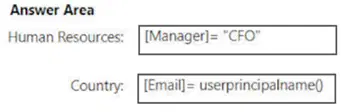
You create two row-level security (RLS) roles named Manager and CFO.
You plan to publish the dataset to the Power BI service.
You need to create DAX expressions for the RLS filters. The solution must meet the following requirements:
• Each manager must see only the data in the Sales and Human Resources tables for their own country.
• The CFO must be prevented from seeing the data in the Human Resources table.
• The CFO must see the sales data of all countries.
How should you complete the DAX expressions to meet the requirements? To answer, drag the appropriate expressions to the correct targets. Each expression may be used once, more than once, or not at all. You may need to drag the split bar between panes or scroll to view content.
NOTE: Each correct selection is worth one point.
You have a Power BI data model that imports data from a Microsoft Excel spreadsheet.
You use Power Query to load a query that contains both renamed and custom columns.
Later, you attempt to reload the query and receive the following error message.
Expression.Error: The column 'Category' of the table wasn't found.
What are two possible causes of the error? Each correct answer presents a complete solution.
NOTE: Each correct selection is worth one point.
The column was removed from the source file.
The column was renamed in the source file.
The file is no longer in the specified location.
You have a Power BI model that contains a table named Sales. The Sales table contains the following columns:
• Order Line ID
• Product ID
• Unit Price
• Order ID
• Quantity
Orders are uniquely identified by using the order ID and can have multiple order lines. Each order line within an order contains a different product ID.
You need to write a DAX measure that counts the number of orders.
Which formula should you use?
Count('Sales'[Order ID])
CountA('Sales' [Order ID])
CountRows('Sales')
DistinctCount('Sales' [Order ID])

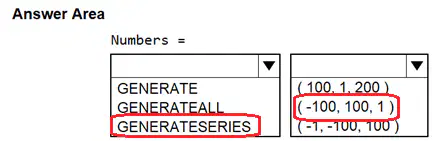
HOTSPOT
-
You are creating a Power BI model in Power BI Desktop.
You need to create a calculated table named Numbers that will contain all the integers from -100 to 100.
How should you complete the DAX calculation? To answer, select the appropriate options in the answer area.
NOTE: Each correct selection is worth one point.
b

In Power Query Editor, you have a query named Sales Data that contains the following columns.
You need to create two queries named Product Dimension and Sales Fact based on the Sales Data query. The solution must minimize maintenance effort and the size of the dataset.
Which two actions should you perform? Each correct answer presents part of the solution.
NOTE: Each correct selection is worth one point.
Reference the Sales Data query to create the new queries.
Disable the load for the Sales Fact query.
Duplicate the Sales Data query to create the new queries.
Clear Include in report refresh for the Sales Data query.
Disable the load for the Sales Data query.
You have a Power BI model that contains a table named Date. The Date table contains the following columns:
• Date
• Fiscal Year
• Fiscal Quarter
• Month Name
• Calendar Year
• Week Number
• Month Number
• Calendar Quarter
You need to create a calculated table based on the Date table. The calculated table must contain only unique combinations of values for Calendar Year, Calendar Quarter, and Calendar Month.
Which DAX function should you include in the table definition?
ADDCOLUMNS
CALCULATE
SUMMARIZE
DATATABLE
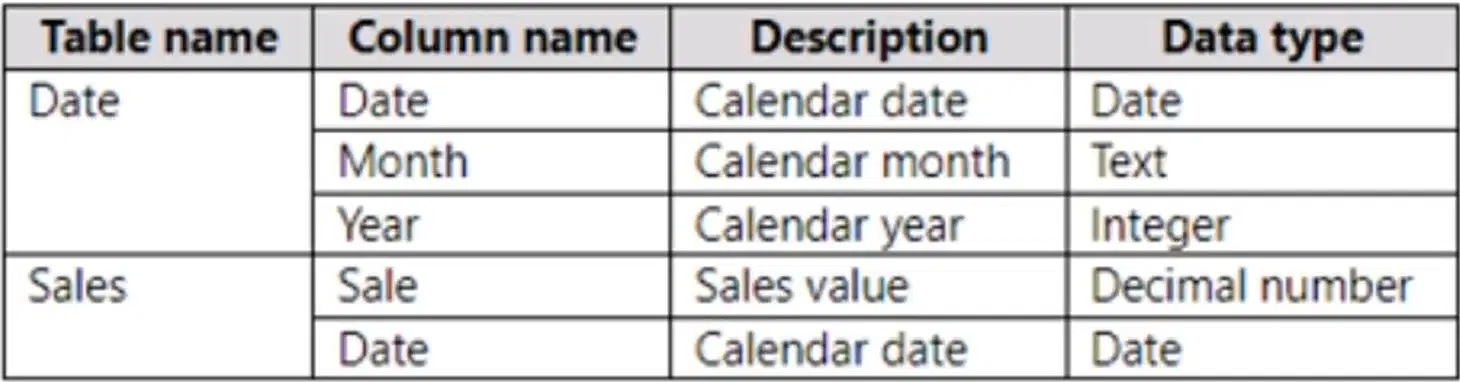
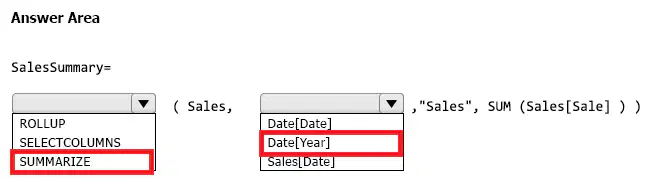
HOTSPOT
-
You have a Power BI model that contains the following data.
The Date table relates to the Sales table by using the Date columns.
You need to create a calculated table that will contain the following:
• A row for each year
• A column that contains the total sales per year
How should you complete the DAX calculation? To answer, select the appropriate options in the answer area.
NOTE: Each correct selection is worth one point.

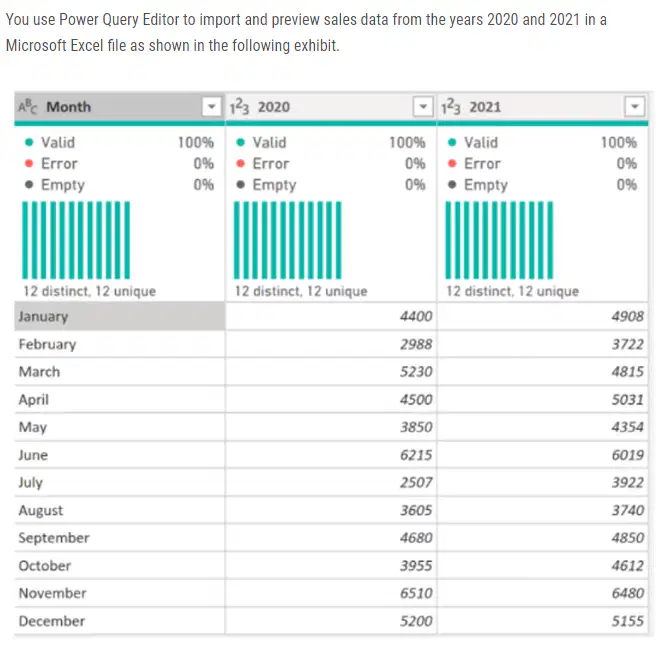
You need to shape the query to display the following three columns:
• Month
• Sales
• Year
What should you select in Power Query Editor?
Merge columns
Transpose
Unpivot columns
Pivot column
HOTSPOT
-
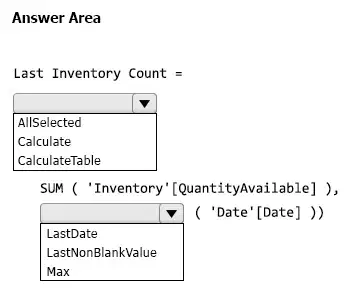
You are creating a Power BI model to analyze inventory.
You load data into three tables named Date, Product, and Inventory. The Inventory table relates to the Date and Product tables by using one-to-many relationships.
Inventory data is recorded daily with no exceptions. The correct inventory quantity for a given product in a month is the last recorded value for that month.
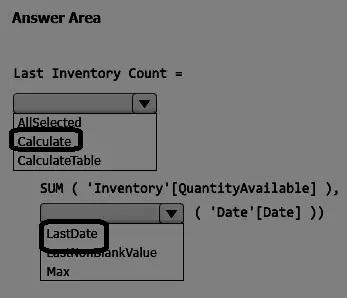
You need to write a DAX measure that will show the correct inventory value when a user analyzes inventory by year, month, or date.
How should you complete the measure? To answer, select the appropriate options in the answer area.
NOTE: Each correct selection is worth one point.
b

You need to support the analysis of sales over time based on all three dates at the same time.
Solution: From the Fields pane, you rename the date table as Due Date. You use a DAX expression to create Order Date and Delivery Date as calculated tables. You create active relationships between the sales table and each date table.
Does this meet the goal?
Yes
No

HOTSPOT
-
You are creating a Power BI report that will show the number of current employees over time. The report will use Import storage mode for all tables.
The employment data will be imported from Azure SQL Database in a monthly snapshot. The data will be stored in a table named Headcount and will contain the following:
• One row per employee for each month the employee is employed
• In each row, a date key that shows the first day of the month of each snapshot
You have a related date table that contains dates for the years 2020 to 2030.
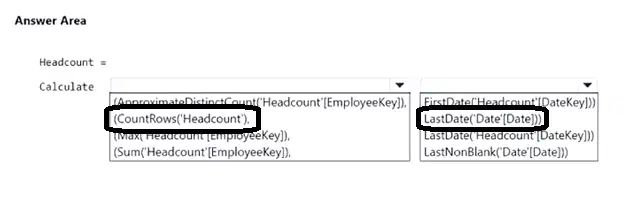
You need to create a semi-additive DAX measure that will return the count of employees for the last available date in a year, quarter, or month.
How should you complete the measure? To answer, select the appropriate options in the answer area.
b

HOTSPOT
-
You have a query named All Sales that imports sales data into a Power BI model.
You plan to create a star schema by separating columns into separate queries and performing further transformations. The solution must meet the following requirements:
• Use All Sales as the source for three other queries named Sales Fact, Product Dimension, and Customer Dimension.
• Minimize maintenance effort.
What should you do to create the Sales Fact query, and for which query should you clear Enable load? To answer, select the appropriate options in the answer area.
NOTE: Each correct selection is worth one point.

b
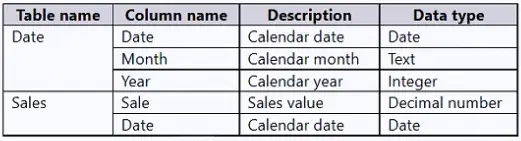
You have a Power BI model that contains the following data.
The Date table relates to the Sales table by using the Date columns.
The model contains the following DAX measure.
Total Sales = SUM(Sales[Sale])
You need to create another measure named Previous Quarter to display the sales one quarter before the selected period.
Which DAX calculation should you use?
CALCULATE ( [Total Sales], DATEADD (Date[Date], -1, QUARTER ) )
CALCULATE ( [Total Sales], DATESQTD (Date[Date] ) )
TOTALQTD ( [Total Sales], Date[Date] )
CALCULATE ( [Total Sales], PARALLELPERIOD (Date[Date], 1, QUARTER ) )
You have a Microsoft Power BI report. The size of PBIX file is 550 MB. The report is accessed by using an App workspace in shared capacity of powerbi.com.
The report uses an imported dataset that contains one fact table. The fact table contains 12 million rows. The dataset is scheduled to refresh twice a day at 08:00 and 17:00.
The report is a single page that contains 15 AppSource visuals and 10 default visuals.
Users say that the report is slow to load the visuals when they access and interact with the report.
You need to recommend a solution to improve the performance of the report.
What should you recommend?
Change any DAX measures to use iterator functions.
Implement row-level security (RLS).
Replace the default visuals with AppSource visuals.
Split the visuals onto multiple pages.

