
 Worksheets
Statistics Review 2 (Topics 5 - 7)
Total questions: 50
Worksheet time: 1hrs 26mins

One hundred and thirty-two individuals were selected at random and asked which brand of car they preferred. They were then sorted by age.
What is the probability that a person, selected at random, is in the 18-34 age group? Write your answer as a decimal rounded to four places.
(a)
One hundred and thirty-two individuals were selected at random and asked which brand of car they preferred. They were then sorted by age.
What is the probability that a person, selected at random, prefers Toyota? Write your answer as a decimal rounded to four places.
(a)
One hundred and thirty-two individuals were selected at random and asked which brand of car they preferred. They were then sorted by age.
What is the probability that a person, selected at random, is in the 35 - 49 age group and prefers Nissan? Write your answer as a decimal rounded to four places.
(a)
One hundred and thirty-two individuals were selected at random and asked which brand of car they preferred. They were then sorted by age.
What is the probability that a randomly selected person prefers Honda, given that they are in the 18 - 34 age group? Write your answer as a decimal rounded to four places.
(a)
One hundred and thirty-two individuals were selected at random and asked which brand of car they preferred. They were then sorted by age.
What is the probability that a person, selected at random, is in the 50 - 65 age group or prefers Toyota? Write your answer as a decimal rounded to four places.
13236+13256≈0.6970
13236+13256−13222≈0.5303
13222≈0.1667
3622≈0.6111
5622≈0.3929
One hundred and thirty-two individuals were selected at random and asked which brand of car they preferred. They were then sorted by age.
Does there appear to be an association between a person's age and what brand of car they prefer?
Yes; A person's age and car brand preference seem to be associated because there is variation in the data.
No; A person's age and car brand preference are independent.

N(0, 1)
Which of the following are properties of a Normal Distribution? Choose all that apply.
symmetric
bell-shaped
positively skewed
negatively skewed
unimodal

What is the value of the mean of this Normal Curve?
(a)
What is the standard deviation of this Normal Curve?
(a)

This data is normally distributed. What percent of the data is in the shaded region?
50%
68%
95%
99.7%

This data is normally distributed. What percent of the data is in the shaded regions?
0.15%
2.35%
5%
10%
0.3%
For patients in Dr. Jones' office, blood pressure has a mean of 115 with a standard deviation of 6. What percent of patients have blood pressure below 115?
0%
25%
50%
100%
75%
For patients in Dr. Jones' office, blood pressure has a mean of 115 with a standard deviation of 6. What blood pressure is 2 standard deviations above the mean?
(a)
Given a mean test score of 75 and a standard deviation of 7, use the Empirical Rule to find the percentage of scores that are between 75 and 82.
68%
50%
34%
25%
10%
The distribution of the annual incomes of a group of employees at Compton Plastics approximates a normal distribution with a mean of $30,000 and a standard deviation of $2000. About 95% of the incomes lie between what two amounts?
$27,000 and $33,000
$28,000 and $36,000
$26,000 and $34,000
$30,000 and $34,000
95% of students weigh between 62 kg and 90 kg.
Assuming this data is normally distributed, what are the mean and standard deviation?
Mean = 66 kg
S.D. = 7 kg
Mean = 76 kg
S.D. = 7 kg
Mean = 86 kg
S.D. = 7 kg
Mean = 76 kg
S.D. = 14 kg
Suppose an average adult drinks 3 liters of water per day. Let's suppose water consumption is normally distributed with a standard deviation of 0.4 liters. What is the z-score for someone who drinks 4 liters per day?
z=σx−μ
(a)
Suppose that a normal model describes the annual snowfall in Massachusetts (in inches). Last year's snowfall measurement had a z-score of -2.2. This means that last year the snowfall was
-2.2 inches total
2.2 inches less than average
2.2 standard deviations below the average
The snowfall is 1 - .22 inches below the average
Jayden scored a 65 on his calculus test, where the class average was 70 and the standard deviation was 10.
Shyann scored a 46 on her algebra quiz, where the class average was 48 and the standard deviation was 3.
Who performed better comparatively on their assessment?
Jayden
Shyann
X is normally distributed with a mean of 12 and a standard deviation of 8.
Which image corresponds to P(X>15) ?


N(0, 1)
P(Z < -0.39) = (a)
Round your answer to four decimal places.
N(0, 1)
P(Z > 1.78) = (a)
Round your answer to four decimal places.

N(10, 5)
P(4<x<12)= _______
0.5404
0.4806
0.5747
0.6802
0.3418
The shelf life of a particular dairy product is normally distributed with a mean of 12 days and a standard deviation of 3 days. If a dairy product is randomly selected, what is the probability that it will be "spoiled" in 8 days or less?
.0912
.4082
.5918
.9082
The scores obtained by students on a math test are normally distributed with a mean score of 61 and a standard deviation of 10. Find the probability that a randomly chosen student obtains a score higher than 85.
0.0082
0.4207
0.1112
0.9918
0.1424
A bank's loan officer rates applicants for credit. The ratings can be described by a Normal model with a mean of 200 and a standard deviation of 50. What percentage ratings can be expected to be between 200 and 275?
43.32%
56.71%
38.61%
29.87%
If I tell you that you scored at the 55th percentile on your final exam, you would know:
55% of the class scored worse than you did.
You earned a 55% on the exam.
You failed the exam.
45% of the class scored worse than you did.
55% of the class scored better than you did.
At the college level, the jumping distances for male long jumpers are approximately normal with a mean of 263 inches and a standard deviation of 14 inches.
Suppose a male long jumper's jump ranked in the 75th percentile. How long was his jump?
Intelligence Quotients (IQs) have a normal distribution of μ= 100 and 𝞂 = 15.
What level of IQ qualifies one to be within the top 5%?
130
125
Which four conditions are true for a binomial distribution?
The probability of a success (p) must be the same for each event.
The probability for each event must be 0.5
There can be only two complementary outcomes: success or failure.
There is a fixed number of trials (sample size).
Each trial must be independent.
In the following situation, identify n, p, q, and x for the binomial distribution:
A sea turtle's chance at survival is 2%. Counting a nest of 82 sea turtles, what is the probability that exactly 1 will survive?
n=82, p=0.02, q=0.98, x=1
n=1, p=0.02, q=0.98, x=82
n=82, p=0.98, q=0.02, x=1
n=1, p=0.98, q=0.02, x=82
Bob is taking a 100 question test. They have a 90% probability of getting any one question correct.
Which is the correct formula to find that Bob will answer exactly 70 questions correctly? P(X=70) = ___
P(x)=nCx⋅px⋅q(n−x)
100C70 ( 0.90 )70 ( 0.10 )0
100C70 ( 0.90 )60 ( 0.10 )30
100C70 ( 0.90 )70 ( 0.10 )30
99C70 ( 0.90 )70 ( 0.10 )30
The American Red Cross says that about 11% of the U.S. population has Type B blood. A blood drive is being held on campus. What is the probability that exactly 2 out of 20 blood donors have Type B blood?
P(X=2) = (a) Round your answer to four decimal places.
P(x)=nCx⋅px⋅q(n−x)
Aja's favorite cereal is running a promotion that says 1-in-4 boxes of the cereal contain a prize. Suppose that Aja is going to buy 5 boxes of this cereal, and let X represent the number of prizes she wins in these boxes. Assume that these boxes represent a random sample, and assume that prizes are independent between boxes.
What is the probability that she wins at most 1 prize in the 5 boxes? P(X≤1)=P(x=0)+P(x=1)
(Round your answer to 4 decimal places.)
(a)
In a particular town, the probability that a randomly chosen voter is a Republican is 0.35.
What is the probability that in a sample of 10 voters in the town, at least 1 will be a Republican?
***Complement Shortcut: P(X≥1)=1−P(none)
0.9865
0.2275
0.0725
0.0135
An egg supplier to a restaurant sends a daily shipment of 500 eggs. Previous records show that 4% of these eggs arrive damaged to the restaurant. Let X = the number of eggs that arrive damaged on a randomly selected day.
Find the mean (expected value) and standard deviation of X.
μ=np and σ=npq
Mean=20
SD = 4.38
Mean = 2000
SD = 34.6
Mean = 200
SD = 11.0
Mean = 2
SD = 1.41
An egg supplier to a restaurant sends a daily shipment of 500 eggs. Previous records show that 4% of these eggs arrive damaged to the restaurant. If the average number of damaged eggs is 20, with a standard deviation of 4.38, would it be unusual for 29 damaged eggs to arrive in a daily shipment?
Usual Range: −2≤Z≤2 or [μ−2σ, μ+2σ]
Yes; 29 is more than 2 standard deviations from the mean.
Yes; 29 is within 2 standard deviations of the mean.
No; 29 is more than 2 standard deviations from the mean.
No; 29 is within 2 standard deviations of the mean.
A company makes electronic components for TV's and found that 90% pass the final inspection. If 150 components are inspected per day, how many are expected to fail?
(a)
A binomial distribution B(n,p) is approximately normal when the number of successes and the number of failures are both 10 or more ( np≥10 and nq≥10 ). For which of the binomial distributions listed below is the normal distribution a reasonable approximation?
B(50, 0.4)
B(40, 0.12)
B(75, 0.11)
B(40, 0.8)
Normal Approximation of a Binomial Distribution:
30% of all dogs in a city are microchipped. In a sample of 500 dogs, what is the probability that less than 140 dogs are microchipped? Select the closest option.
25%
21%
16%
13%
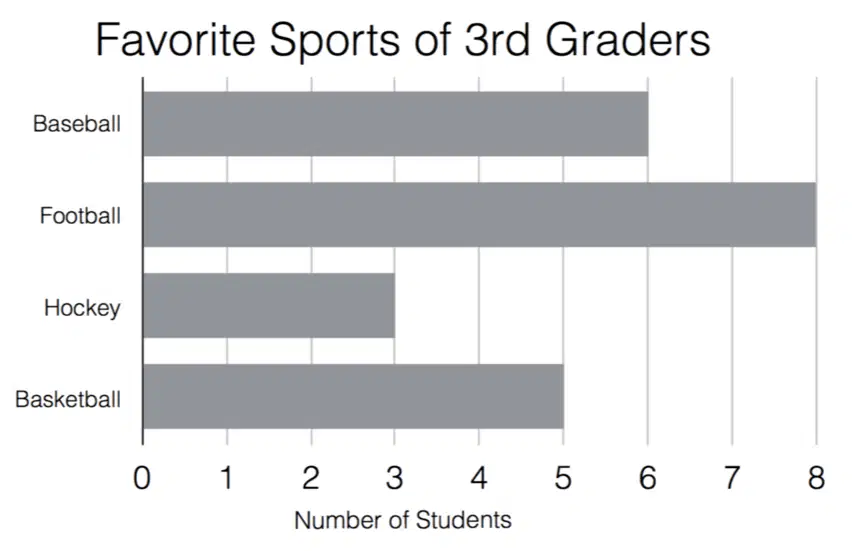
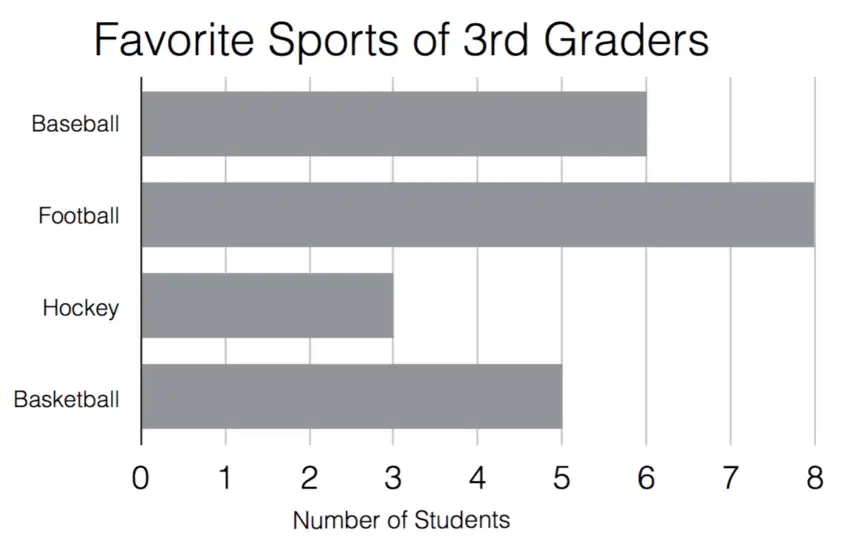
How many students voted for their favorite sport?
(a)

Which of the following statements are true? [Select all that apply.]
From January to March, chocolate sales dropped drastically. They then boomed to 50% in April before decreasing slightly in the last month.
From January to May, ice cream sales decreased at a steady rate. Ice cream sales in May were 40% less than what they were in January.
From January to May, biscuit sales increased from 40% to 95%. In the last month, buscuit sales were more than double the chocolate sales.

What does the x-axis of this bar graph show?
Types of Fruit
Number of People

What frequency scale does the bar graph use?
1
2
5
10

Look at the bar graph and answer the following question:
Which is the most common type of allergy among children 0-4 years old?
Respiratory allergy
Food allergy
Skin Allergy
Look at the bar graph and answer the following question:
What percentage of children between 10-17 years old have a food allergy?
5%
10%
20%
Look at the bar graph and answer the following question:
Which type of allergy is more common among children 5-9 years old?
Respiratory allergy
Food allergy
Skin Allergy
Look at the bar graph and answer the following question:
Which type of allergy shows the smallest difference between age groups?
Respiratory allergy
Food allergy
Skin Allergy

