wayground logo

Free Printable Worksheets

Font size

S
M
L
XL
Worksheets

6th Grade First Semester Science Final

Total questions: 202

Worksheet time: 5hrs 58mins

Name
Class
Date
1.
What type of graph is this?
a)
Line Graph
b)
Pictograph
c)
Bar Graph
d)
Histogram
2.
What type of graph is this?
a)
Line Graph
b)
Pictograph
c)
Bar Graph
d)
Histogram
3.

Based on the graph, how many more students are in the science club than the book club?

a)

20

b)

16

c)

46

d)

18

4.

The graph shows how employees at Disney World travel to work. How many employees ride bikes, ride the bus, or walk to work?

a)

300

b)

450

c)

325

d)

375

5.

How many 4 legged animals are on this farm?

a)

29

b)

14

c)

33

d)

22

6.

How many students voted?

a)

13

b)

26

c)

55

d)

42

7.

Look at the Bar Graph "Student Grades". Which grade did the smallest number of students get?

a)

A

b)

B

c)

C

d)

D

8.
How many students' favorite color is blue?
a)
11
b)
12
c)
14
d)
17
9.

How many more potatoes were grown in 2011 than in 2009?

a)

5

b)

10

c)

15

d)

20

10.

What happened on Thursday?

a)

Cookie sales went up

b)

Cookie sales went down

c)

Cookie sales stayed the same

d)

6 boxes were sold

11.

How many birthdays are there is December?

a)

7

b)

6

c)

8

d)

5

12.
How many push-ups were done on Monday?
a)
5
b)
10
c)
15
d)
20
13.
Between which two days was the greatest decrease in push-ups?
a)
Friday and Saturday
b)
Tuesday and Wednesday
c)
Sunday and Monday
d)
Thursday and Friday
14.
Did the temperature increase or decrease between day 1 and day 2?
a)
increase
b)
decrease
15.

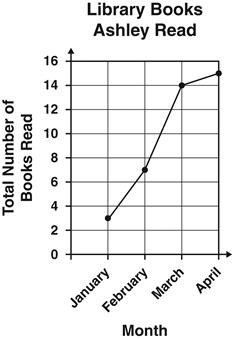
The graph below shows the total number of books Ashley had read by the end of each month for four months. During which month did Ashley read the fewest number of books?

a)

January

b)

February

c)

March

d)

April

16.
Which type of graph is this?
a)
Bar Graph
b)
Stem Plot
c)
Box Plot
d)
Histogram
17.
Which type of graph is this?
a)
Bar Graph
b)
Stem Plot
c)
Box Plot
d)
Histogram
18.
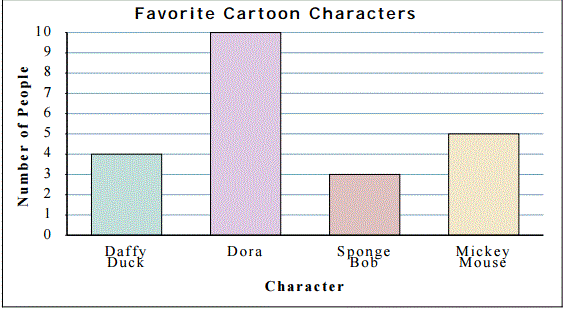
What is the title of the graph?
a)
Number of people
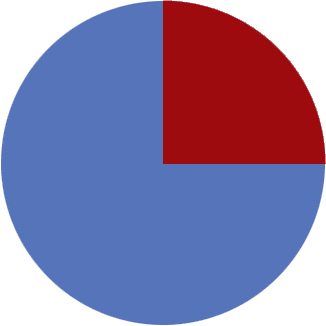
b)
Character
c)
Favorite Cartoon Characters
d)
Sponge Bob
19.
Which type of graph is this?
a)
Bar Graph
b)
Stem Plot
c)
Box Plot
d)
Histogram
20.
What type of graph is this?
a)
Bar Graph
b)
Dot Plot
c)
Histogram
d)
Line Graph
21.
What is the title of this graph?
a)
School Transportation
b)
Bus
c)
No title
d)
Pie Graph
22.
How many total votes were collected?
a)
5
b)
10
c)
15
d)
20
23.
Which unit would you use to measure the liquid volume of a ketchup packet?
a)
pints
b)
milliliters
c)
liters
d)
quarts
24.
Which unit would you use to measure the capacity of a gas tank?
a)
gallons
b)
cups
c)
milliliters
d)
inches
25.
Which unit would you use to measure the liquid volume of a ketchup packet?
a)
pints
b)
milliliters
c)
liters
d)
quarts
26.
Which unit would you use to measure the capacity of a pitcher of lemonade?
a)
quarts
b)
pints
c)
milliliters
d)
gallons
27.
Which unit would you use to measure the liquid volume of a bath tub?
a)
milliliters
b)
quarts
c)
cups
d)
liters
28.
Which unit would you use to measure the capacity of a blueberry container?
a)
gallons
b)
cups
c)
pints
d)
milliliters
29.
Mom needs 3 baby pools for a pool party. Each baby pool holds 20 gallons of water.  How many gallons of water total?
a)
20 gallons
b)
60 gallons
c)
120 gallons
d)
80 gallons
30.
Jerry bought 5 milk jugs at the store.  Each milk jug holds 4 quarts of milk.  What is the total number of quarts of milk that Jerry bought?
a)
9 quarts
b)
25 quarts
c)
1 quart
d)
20 quarts
31.
Katie bought 80 liters of soda for a party.  38 liters of soda were drank.  How many liters of soda does Katie have left?
a)
42 liters
b)
58 liters
c)
118 liters
d)
108 liters
32.
Glenda baked peanut butter chocolate chip cookies.  She used 2 cups of white sugar and 2 cups of brown sugar. She used 2 cups peanut butter and 1 cup of chocolate chips.  She also used 4 cups of flour.  How many cups of ingredients did she use?
a)
10 cups
b)
11 cups
c)
8 cups
d)
9 cups
33.

Amaya fills 5 large buckets with water. Each bucket holds 3 liters. How many liters of water does she have total?

a)

25 liters

b)

10 liters

c)

15 liters

d)

100 liters

34.

1 pint =_______ cups

a)

2 cups

b)

4 cups

c)

8 cups

d)

16 cups

35.

What would you use to measure the volume of the liquid inside?

a)

gallons

b)

pints

36.

What are the customary units?

a)

cups, pints, gallon, inches

b)

gallon, cups, quarts, and pints

c)

cups, quarts, pints, and mL

d)

gallon, quarts, feet, and cups

37.
How many quarts are in ONE gallon?
a)
3
b)
2
c)
4
d)
8
38.
1 gallon =
a)
4 quarts
b)
8 pints
c)
16 cups
d)
All of the choices
39.
Liquid capacity means
a)
how much something weighs
b)
how much liquid there is
c)
how long something is
d)
what color something is
40.
16 cups =
a)
1 Gallon
b)
1 Quart
c)
1 Pint
d)
1 Cup
41.
What tool is used to measure liquid capacity?
a)
a measuring cup
b)
a scale
c)
a ruler
d)
a clock
42.
2 gallons =
a)
4 quarts
b)
12 quarts
c)
16 quarts
d)
8 quarts
43.

Place the following in order

a)

Question

b)

Hypothesis

c)

Experiment

d)

Conclusion

e)

Analyze

1)
2)
3)
4)
5)
44.

CHARTS AND GRAPHS ARE ALL PART OF ___________.

a)

PROCEDURES

b)

ANALYZING DATA

c)

MATERIALS

d)

QUESTION

45.

LISTING PROCEDURES AND MATERIALS ARE PART OF THE __________?

a)

EXPERIMENT

b)

QUESTION

c)

HYPOTHESIS

d)

CONCLUSION

46.

An educated GUESS OR PREDICTION

a)

CONCLUSION

b)

RESEARCH

c)

ANALYZE

d)

HYPOTHESIS

47.

After you make an observation you state the ____________?

a)

Problem/Question

b)

Hypothesis

c)

Conclusion

d)

Research

48.

The first step in the Scientific Method is ___________?

a)

State your HYPOTHESIS

b)

RESEARCH

c)

MAKING AN OBSERVATION

d)

ANALYZING DATA

49.

In 6th grade, every proper hypothesis begins with what word?

a)

Does

b)

If

c)

Because

d)

Then

50.

Science can change and is a continually ongoing process.

a)

True

b)

False

51.

What step does every scientific experiment begin with?

a)

hypothesis

b)

question/problem

c)

background research

d)

conclusion

52.

Which of these contains the steps of the scientific method in the correct order?

a)

Ask a question, do background research, state your hypothesis, conduct an experiment, analyze data, make a conclusion

b)

State your hypothesis, ask a question, do background research, conduct an experiment, analyze data, make a conclusion

c)

Ask a question, state your hypothesis, do background research, conduct an experiment, make a conclusion, analyze data

d)

State your hypothesis, ask a question, do background research, make a conclusion, conduct an experiment, analyze data

53.
Should experiments be repeated over and over to see if the results are the same each time?
a)
yes
b)
no
54.
The summary at the end of an experiment that explains the results. 
a)
conclusion
b)
procedures
c)
materials
d)
responding variable
55.

The __________________________________ is the organized way scientists answer questions and solve problems.

a)

scientific method

b)

scientific explanation

c)

scientific notation

d)

scientific guesses

56.
Another word for prediction or educated guess is: ________________
a)
hypothesis
b)
conclusion
c)
experiment
d)
data
57.
The information you record in an experiment is called your ____________.
a)
data
b)
conclusions
c)
notebook
d)
inquiry
58.

In 6th grade, every proper hypothesis begins with what word?

a)

Does

b)

If

c)

Because

d)

Then

59.

When should you write a hypothesis?

a)

After writing procedures

b)

After making observations and doing research on a question/problem

c)

After buying materials for an experiment

d)

At the very beginning of the experiment

60.
A hypothesis is 
a)
a random guess
b)
an explanation that answers a question
c)
an experiment
61.
A hypothesis is based on observations and research
a)
True
b)
False
62.

Choose the correct beginning for this hypothesis.


________________, then I will be clean.

a)

I will take a shower

b)

If I take a shower

c)

Because I take a shower

d)

Since I took a shower

63.

What is the measurement the line is pointing to?

a)

15/16"

b)

3/4"

c)

1"

d)

1 1/16"

64.

What is the measurement the line is pointing to?

a)

1 1/2"

b)

1 1/4"

c)

1/4"

d)

1 3/8"

65.

What is the measurement the line is pointing to?

a)

2"

b)

2 3/16"

c)

2 1/4"

d)

2 3/4"

66.

What is the measurement the line is pointing to?

a)

3"

b)

3 1/4"

c)

3 3/8"

d)

3 1/16"

67.

What is the measurement the line is pointing to?

a)

3 7/8"

b)

3 5/8"

c)

3 3/4"

d)

4"

68.

What is the measurement the line is pointing to?

a)

5"

b)

5'

c)

5 1/16"

d)

5 1/4"

69.

What is the measurement the line is pointing to?

a)

5 3/4"

b)

5 7/8"

c)

5 1/2"

d)

6"

70.

True or False


One tick mark after a number indicates feet (1') two tick marks after a number indicates inches (1")?

a)

True

b)

False

71.

True or False


One tick mark after a number indicates feet (1') two tick marks after a number indicates inches (1")?

a)

True

b)

False

72.

True or False


One tick mark after a number indicates feet (1') two tick marks after a number indicates inches (1")?

a)

True

b)

False

73.

What is the measurement?

a)

4 1/2"

b)

3 3/8"

c)

3 1/2"

d)

3 5/16"

74.

What is the measurement?

a)

10"

b)

10 1/16"

c)

10 1/8"

d)

10 1/4"

75.

What is the measurement?

a)

10 1/2"

b)

11 1/2"

c)

11 1/8"

d)

10 5/8"

76.

What is the measurement?

a)

3 3/16"

b)

3 5/16"

c)

3 9/16"

d)

4 3/16"

77.

What is the measurement?

a)

10 1/4"

b)

10 3/16"

c)

10 9/16"

d)

10 11/16"

78.

What is the measurement?

a)

13 1/4"

b)

13 5/16"

c)

14 1/16"

d)

13 11/16"

79.

What is the measurement?

a)

11 1/16"

b)

11 9/16"

c)

12 1/16"

d)

11 15/16"

80.

What is the 1st of the scientific method?

a)

observation

b)

question

c)

method

d)

hypothesis

81.

What is the 3rd step of the scientific method?

a)

method

b)

result

c)

observation

d)

hypothesis

82.

What is the 4th step of the scientific method?

a)

hypothesis

b)

method

c)

result

d)

observation

83.

What is the 6th step of the scientific method?

a)

observation

b)

result

c)

conclusion

d)

hypothesis

84.
  1. give step by step instructions to conduct the experiment 

a)

hypothesis

b)

result

c)

method

d)

conclusion

85.
  1. ask questions about what you observed 

a)

observation

b)

question

c)

method

d)

hypothesis

86.
  1. form an educated guess to your questions 

a)

conclusion

b)

observation

c)

hypothesis

d)

method

87.
  1. summarize your experiment and state whether your hypothesis was correct or incorrect 

a)

observation

b)

result

c)

method

d)

conclusion

88.
  1. study something using your five senses 

a)

hypothesis

b)

observation

c)

method

d)

question

89.

The third step of the scientific method that involves making an educated guess about what will happen.

a)

experiment

b)

conclusion

c)

gather information

d)

question

e)

hypothesis

90.

The first step of the scientific method that involves thinking about what you want to know.

a)

experiment

b)

question

c)

hypothesis

d)

data

e)

gather information

91.

The sixth step of the scientific method that involves using the data gathered from your experiment to explain what happened.

a)

conclusion

b)

question

c)

hypothesis

d)

gather information

e)

data

92.

The second step of the scientific method that involves researching and observing to learn about your question or topic.

a)

data

b)

gather information

c)

experiment

d)

conclusion

e)

hypothesis

93.

The variable that you keep the same to ensure that your experiment is valid.

a)

independent variable

b)

dependent variable

c)

controlled variable

94.

The variable that you are measuring in the experiment (this is where your quantitative data comes from).

a)

independent variable

b)

dependent variable

c)

controlled variable

95.

The variable that you are testing in your experiment (the one that changes).

a)

independent variable

b)

dependent variable

c)

controlled variable

96.

Data that includes numbers (measurements and amounts).

a)

qualitative data

b)

quantitative data

97.

Which step of the scientific method is this example-

Does the volume of water change when it freezes?

a)

question

b)

hypothesis

c)

experiment

d)

data

e)

conclusion

98.

Which step of the scientific method is this example-

Using clear containers with measurement marks, I will compare the volume of a glass of water at room temperature with a glass of frozen water.

a)

question

b)

hypothesis

c)

experiment

d)

data

e)

conclusion

99.

Which step of the scientific method is this example-

If the molecular structure of solids is more dense than liquids, then water will decrease in volume when it freezes.

a)

question

b)

hypothesis

c)

experiment

d)

data

e)

conclusion

100.

Which step of the scientific method is this example-

Container #: State of Water: Height:

1- water =14.0 mL, ice =14.8 mL

2-water=20.0 mL, ice= 20.8 mL

3-water= 24.0 mL, ice=24.9 mL

a)

question

b)

hypothesis

c)

experiment

d)

data

e)

conclusion

101.

Data that does not include numbers, but describes things instead.

a)

qualitative data

b)

quantitative data

102.

Data that includes numbers (measurements and amounts).

a)

qualitative data

b)

quantitative data

103.

The variable that you are testing in your experiment (the one that changes).

a)

independent variable

b)

dependent variable

c)

controlled variable

104.

The variable that you keep the same to ensure that your experiment is valid.

a)

independent variable

b)

dependent variable

c)

controlled variable

105.
What type of graph is this?
a)
Bar Graph
b)
Pictograph
c)
Dot Plot
d)
Circle Graph
106.
What type of graph is this?
a)
Bar Graph
b)
Dot Plot
c)
Histogram
d)
Line Graph
107.
What is the title of this graph?
a)
Numbers
b)
Dot Plot
c)
There is no title
d)
Hours Spent Doing Homework
108.
How many students spent 7 hours doing homework that week?
a)
1
b)
3
c)
5
d)
6
109.
What type of graph is this?
a)
Bar Graph
b)
Histogram
c)
Dot Plot
d)
Pie Graph
110.
What type of graph is this?
a)
Dot Plot
b)
Pie Graph
c)
Line Graph
d)
Histogram
111.
What is the title of this graph?
a)
School Transportation
b)
Bus
c)
No title
d)
Pie Graph
112.
When would I use a graph like this?
a)
To see small changes over time
b)
To compare parts to a whole
c)
To compare categories
d)
To see frequency
113.
Elliot says almost everyone arrived at the party after 10:00 P.M., but Nancy thinks most people came earlier. When did a most of the people arrive? 
a)
7:00-7:59 P.M.
b)
8:00–8:59 P.M.
c)
9:00–9:59 P.M.
d)
10:00–10:59 P.M. 
114.
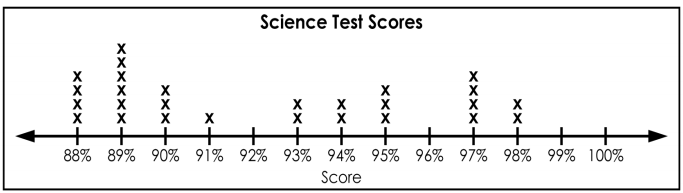
How many more students scored a 88 than scored a 98?
a)
4
b)
2
c)
6
d)
35
115.
When would I use a graph like this?
a)
To show changes over time
b)
To compare quantity or popularity
c)
To compare parts to a whole
d)
To show frequency
116.
What is this graph missing?
a)
Axes
b)
Title
c)
Categories
d)
None of these
117.
I only have an x-axis. I help to compare quantity and popularity. What am I?
a)
Circle Graph
b)
Histogram
c)
Line Graph
d)
Dot Plot
118.
I have an x-axis and a y-axis. I help to track changes over time. What am I?
a)
Circle Graph
b)
Histogram
c)
Line Graph
d)
Dot Plot
119.
I have an x-axis and a y-axis. I help to show frequency. There are no spaces between my bars. What am I?
a)
Bar Graph
b)
Histogram
c)
Line Graph
d)
Dot Plot
120.
What type of graph is this?
a)
Bar Graph
b)
Dot Plot
c)
Histogram
d)
Line Graph
121.
What type of graph is this?
a)
Line Graph
b)
Dot Plot
c)
Histogram
d)
Circle Graph
122.
What is the title of this graph?
a)
Numbers
b)
Dot Plot
c)
There is no title
d)
Hours Spent Doing Homework
123.
How many students spent 7 hours doing homework that week?
a)
1
b)
3
c)
5
d)
6
124.
What type of graph is this?
a)
Bar Graph
b)
Histogram
c)
Dot Plot
d)
Pie Graph
125.
What type of graph is this?
a)
Dot Plot
b)
Pie Graph
c)
Line Graph
d)
Histogram
126.
What is this?
a)
Data Table
b)
Tape Diagram
c)
Histogram
d)
I don't know
127.
When would I use a graph like this?
a)
To see small changes over time
b)
To compare parts to a whole
c)
To compare categories
d)
To see frequency
128.
When would I use a graph like this?
a)
To see changes over time
b)
To compare parts to a whole
c)
To compare categories
d)
To see frequency
129.
When would I use a graph like this?
a)
To show changes over time
b)
To compare quantity or popularity
c)
To compare parts to a whole
d)
To show frequency
130.
How many more students scored a 88 than scored a 98?
a)
4
b)
2
c)
6
d)
35
131.
What is this graph missing?
a)
Axes
b)
Title
c)
Categories
d)
None of these
132.

Based on the graph, how many more students are in the science club than the book club?

a)

20

b)

16

c)

46

d)

18

133.

How many 4 legged animals are on this farm?

a)

29

b)

14

c)

33

d)

22

134.

How many students voted?

a)

13

b)

26

c)

55

d)

42

135.

Look at the Bar Graph "Student Grades". Which grade did the smallest number of students get?

a)

A

b)

B

c)

C

d)

D

136.
How many students' favorite color is blue?
a)
11
b)
12
c)
14
d)
17
137.

How many more potatoes were grown in 2011 than in 2009?

a)

5

b)

10

c)

15

d)

20

138.

How many birthdays are there is December?

a)

7

b)

6

c)

8

d)

5

139.
When was the greatest amount of shoppers at the store?
a)
10am
b)
1pm
c)
6pm
d)
2pm
140.
Did the temperature increase or decrease between day 1 and day 2?
a)
increase
b)
decrease
141.

The graph below shows the total number of books Ashley had read by the end of each month for four months. During which month did Ashley read the fewest number of books?

a)

January

b)

February

c)

March

d)

April

142.
How many more people does Sprint need to have to be equal to AT&T?
a)
8
b)
6
c)
5
d)
7
143.

What day was the LEAST popcorn sold?

a)

Monday

b)

Tuesday

c)

Wednesday

d)

Thursday

144.

How many slam dunks did the Celtics score?

a)

1

b)

2

c)

3

d)

4

145.

Look at the bar graph, "Nicest Fruit". What does the y-axis show?

a)

Types of fruit

b)

Number of people.

146.
Which day had more minutes of homework?
a)
Wednesday
b)
Thursday
c)
Friday
d)
Ms. Jones
147.
How many students' favorite color is blue?
a)
11
b)
12
c)
14
d)
17
148.
How many more people like purple than red?
a)
3
b)
5
c)
7
d)
9
149.
How long is the paper clip?
a)
1 inch
b)
3 inches
c)
2 inches
150.
The screwdriver is AT the halfway mark, so is it closer to 2 inches or 3 inches?
a)
2 inches
b)
3 inches
151.

Measure the napkin to the nearest eigth!

a)

6 4/8 inches

b)

6 3/8 inches

c)

7 1/8 inches

d)

6 2/8 inches

152.

Measure the pen to the nearest half inch!

a)

5 1/2 inches

b)

6 inches

c)

5 4/8 inches

d)

4 1/2 inches

153.

Measure the purple crayon in the picture to the nearest half!

a)

3 4/8 inches

b)

3 1/2 inches

c)

3 inches

d)

2 1/2 inches

154.
Mary has 3 ribbons.  The measurements of the ribbons are 4 inches, 7 inches, and 10 inches.  The red ribbon is 10 inches long.  The blue ribbon is the shortest.  How long is the purple ribbon?
a)
4 inches
b)
10 inches
c)
21 inches
d)
7 inches
155.
What fraction is represented at point B?
a)
4/10
b)
4/11
c)
5/11
d)
5/10
156.
What fraction is represented on the number line?
a)
1/1
b)
2/3
c)
1/2
d)
0/1
157.
Which point shows 2/12?
a)
Point W
b)
Point X
c)
Point Y
d)
Point Z
158.
What fraction is closest to    0
a)
4/7
b)
1/10
c)
8/9
d)
11/12
159.

In a lab that uses any liquids, when must you wear these over your eyes?

a)

at all times

b)

They just need to be on your head, not covering your eyes.

c)

whenever you are looking at your experiment

d)

When you need to see the board better

160.

What is the name of this scientific tool?

a)

splash goggles

b)

meter stick

c)

hand lens

d)

beaker

161.

What is this tool used for?

a)

measuring volume of a solid

b)

measuring mass

c)

magnification of an object

d)

measuring temperature

162.

What is the name of the tool pictured?

a)

hand lens

b)

graduated cylinder

c)

triple beam balance

d)

meter stick

163.

What tool would you use if you wanted to measure the MASS of an object during a laboratory investigation?

a)

a triple beam balance

b)

a graduated cylinder

c)

a meter stick

d)

a thermometer

164.
You need to measure out 75 ml of water. Which graduated cylinder should you use?
a)
50 ml graduated cylinder 
b)
100 ml graduated cylinder 
c)
150 ml graduated cylinder 
d)
250 ml graduated cylinder 
165.

what is the mass of the rock shown in the image?

a)
354.6 g
b)
350.46 g
c)
35.46 g
d)
463.5 6
166.

what is the mass of the rock shown in the image?

a)
354.6 g
b)
350.46 g
c)
35.46 g
d)
463.5 6
167.
What is the mass on this triple beam?
a)
220g
b)
222g
c)
20g
168.
What is the mass on this triple beam?
a)
40g
b)
1g
c)
401g
d)
41g
169.
What is the mass on this triple beam?
a)
270g
b)
202g
c)
272g
d)
200g
170.
What is the mass on this triple beam?
a)
143g
b)
40g
c)
43g
d)
3g
171.
What is the mass on this triple beam?
a)
272g
b)
702g
c)
202g
172.
What is the mass on this triple beam?
a)
270g
b)
202g
c)
273g
173.
What is the mass on this triple beam?
a)
506g
b)
576g
c)
570g
174.
What is the mass on this triple beam?
a)
200g
b)
44g
c)
244g
d)
4g
175.
What is the mass on this triple beam?
a)
143g
b)
40g
c)
43g
d)
3g
176.
What is the mass on this triple beam?
a)
272g
b)
702g
c)
202g
177.

Find the mass.

a)

550.4 g

b)

559.4 g

c)

550.6 g

178.

Find the mass.

a)

285.3 g

b)

275.5 g

c)

275.3 g

179.

What is the value on the balance?

a)

480.5 g

b)

840.05 g

c)

408 g

180.

What is the value on the balance?

a)

240.0 g

b)

142.0 g

c)

100.4 g

181.

How do you feel you did?

a)

Great! It was easy. I knew all the answers

b)

Good. I knew the majority of the answers

c)

50/50. I knew only about half of the answers

d)

Bad. I knew none of the answers.

182.

What type of graph is this?

a)

line plot

b)

line graph

c)

bar graph

d)

frequency table

183.

When is a good time to use a dot plot? (2 answers)

a)

To help you find the smallest and largest values.

b)

When you need to make a graph in the fastest way possible.

c)

When you don't have a ruler to draw a column graph.

d)

When you compare frequency distributions.
184.

What type of graph is shown?

a)

pictograph

b)

stem and leaf

c)

pie chart

d)

histogram

185.

What fraction of the graph is red?

a)

1

---

2

b)

1

---

4

c)

3

---

4

d)

90 degrees

186.
Which Continent is home to 36% of the wild cats?
a)
Asia
b)
Africa
c)
North America
d)
South America
187.

What was the population of whales in 2019?

a)

100

b)

10

c)

99

d)

32

188.
How much does it cost to have your lawn mowed for 2 hours?
a)
$16
b)
$17
c)
$18
d)
$19
189.
How many push-ups were done on Monday?
a)
5
b)
10
c)
15
d)
20
190.
When was the greatest amount of shoppers at the store?
a)
10am
b)
1pm
c)
6pm
d)
2pm
191.
How many people purchased no food and no drink?
a)
60
b)
10
c)
20
d)
200
192.
What color car is the least popular at this car dealership?
a)
Red
b)
White
c)
Blue
d)
Green
193.
a)

14 inch\frac{1}{4}\ inch

b)

12 inch\frac{1}{2}\ inch

c)

1 inch

d)

2 inches

194.
a)

4 12 inches4\ \frac{1}{2}\ inches

b)

5 34 inches5\ \frac{3}{4}\ inches

c)

4 14 inches4\ \frac{1}{4}\ inches

d)

4 inches

195.
a)

5125\frac{1}{2} inches

b)

5 14 inches5\ \frac{1}{4}\ inches

c)

5 34 inches5\ \frac{3}{4}\ inches

d)

4 12 inches4\ \frac{1}{2}\ inches

196.
How many inches is the green rectangle?
a)
3 inches
b)
4 inches
c)
5 inches
d)
6 inches
197.
Measure using inches
a)
3 in.
b)
3  ½ in.
c)
3 ¼ in.
d)
3  ¾ in.
198.
Measure this line using inches.
a)
0 in.
b)
½ in.
c)
1 in.
d)
¾ in.
199.
Measure this line using inches.
a)
5 ¾ in.
b)
6 in.
c)
5 ½ in.
d)
5 ¼ in.
200.
Measure this line using inches.
a)
2 ¾ in.
b)
3 in.
c)
2 ¼ in.
d)
2 ½ in.
201.

What is the measurement?

a)

7 3/8

b)

7 7/16

c)

7 1/4

d)

7 1/2

202.

What grade do you believe you earned?

a)

A+ 100-95

b)

A- 94-90

c)

B+ 89-85

d)

B- 84- 80

e)

Less than a B -