
 Worksheets
IB ESS Unit 8.1 Population growth
Total questions: 201
Worksheet time: 3hrs 42mins
What is the current global human population?
Always increasing, currently at 20 billion
Steadily decreasing to 5 billion
Varies, but approximately 10 billion
Varies, but approximately 7.9 billion
Explain the concept of age-gender pyramids and its significance in demographic studies.
Age-gender pyramids show the distribution of income and education level in a population and are significant in demographic studies for understanding economic development.
Age-gender pyramids show the distribution of housing types and are significant in demographic studies for understanding urban development.
Age-gender pyramids show the age and gender distribution of a population and are significant in demographic studies for understanding population structure, growth, and trends over time.
Age-gender pyramids show the distribution of political affiliation in a population and are significant in demographic studies for understanding voting patterns.
Describe the demographic transition model and its different stages.
Stage 1 - late expanding
Stage 3 - early expanding
The demographic transition model consists of four stages: Stage 1 - high stationary, Stage 2 - early expanding, Stage 3 - late expanding, and Stage 4 - low stationary.
Stage 2 - high stationary
Discuss the factors that influence human population dynamics.
Alien invasions, zombie apocalypses, natural disasters
Number of pets owned, favorite color, preferred mode of transportation
Birth rates, death rates, immigration, emigration, economic development, education, healthcare, and access to resources
Weather patterns, social media, fashion trends
Explain the use of demographic tools in analyzing population data.
They are used to analyze weather patterns
They are used to provide insights into population structure, trends, and characteristics.
They are used to study the behavior of animals
They are used to predict stock market trends
What is the projected global human population by the year 2050?
9.7 billion
10 billion
12 billion
6.5 billion
Compare and contrast the age-gender pyramids of a developed country and a developing country.
Age-gender pyramids of developed countries show a larger proportion of younger individuals and a smaller proportion of older individuals, while developing countries tend to have a more even distribution across age groups with a larger proportion of older individuals.
Age-gender pyramids of developed countries show a more even distribution across age groups with a larger proportion of older individuals, while developing countries tend to have a larger proportion of younger individuals and a smaller proportion of older individuals.
Age-gender pyramids of developed countries show a larger proportion of older individuals and a smaller proportion of younger individuals, while developing countries tend to have a larger proportion of older individuals and a smaller proportion of younger individuals.
Age-gender pyramids of developed countries show a larger proportion of older individuals and a smaller proportion of younger individuals, while developing countries tend to have a more even distribution across age groups with a larger proportion of younger individuals.
Discuss the implications of an aging population on a country's economy.
An aging population can lead to a decrease in the workforce, increased healthcare costs, and a strain on pension systems, which can negatively impact the economy.
An aging population can lead to an increase in the workforce, decreased healthcare costs, and a boost to pension systems, which can positively impact the economy.
An aging population leads to a decrease in the workforce, but it reduces healthcare costs and has no impact on pension systems.
An aging population has no impact on the economy.
Explain the concept of carrying capacity in relation to human population growth.
The concept of carrying capacity refers to the minimum population size that an environment can sustain indefinitely.
Carrying capacity is the average population size that an environment can sustain for a short period of time.
Carrying capacity is the maximum population size that an environment can sustain for a limited time.
The concept of carrying capacity relates to the maximum population size that an environment can sustain indefinitely.
How can governments use demographic data to inform policy decisions?
By ignoring demographic data and making decisions based on personal opinions
By randomly selecting policies without considering demographic data
By using demographic data from a different country to inform policy decisions
By understanding the population's needs, trends, and challenges, which can help in designing targeted policies and programs.
What is population growth rate?
The population growth rate is the rate at which the population of a particular area or country fluctuates randomly over a specific period of time.
The population growth rate is the rate at which the population of a particular area or country decreases over a specific period of time.
The population growth rate is the rate at which the population of a particular area or country increases over a specific period of time.
The population growth rate is the rate at which the population of a particular area or country remains constant over a specific period of time.
Explain the demographic transition model.
The demographic transition model explains the process of population change over time and includes four stages: pre-industrial, transitional, industrial, and post-industrial.
The demographic transition model explains the process of population change over time and includes two stages: pre-industrial and post-industrial.
The demographic transition model explains the process of population change over time and includes five stages: pre-industrial, transitional, industrial, post-industrial, and futuristic.
The demographic transition model explains the process of population change over time and includes three stages: pre-industrial, transitional, and post-industrial.
Define population density.
Population density is the average age of individuals in a given area.
Population density is the total land area of a given population.
Population density is the number of individuals per unit volume.
Population density is the number of individuals per unit area.
What factors affect population distribution?
Education, healthcare, transportation, and infrastructure
Religion, language, and ethnicity
Geographical features, such as mountains and rivers
Climate, resources, economic opportunities, political stability, and cultural factors
What are population pyramids used for?
To visualize and analyze the age and gender distribution of a population.
To analyze the economic status of a population.
To predict future population growth.
To measure the total population of a country.
What is the formula to calculate population growth rate?
Births - Deaths / Total population
(Births + Immigration) - (Deaths + Emigration) / Total population
(Births + Immigration) - (Deaths + Emigration) / Total population + Total population
(Births + Immigration) - (Deaths + Emigration) / Total population
Name the four stages of the demographic transition model.
Step 1, Step 2, Step 3, Step 4
Phase 1, Phase 2, Phase 3, Phase 4
Stage 1, Stage 2, Stage 3, Stage 4
Level 1, Level 2, Level 3, Level 4
What are the three types of population distribution patterns?
clustered, dispersed, and even
aggregated, separated, and haphazard
grouped, scattered, and irregular
clumped, uniform, and random
What does a wide base in a population pyramid indicate?
A high proportion of elderly people in the population.
An equal proportion of young and elderly people in the population.
A low proportion of young people in the population.
A high proportion of young people in the population.
What does a narrow top in a population pyramid indicate?
Low birth rate and low death rate
High birth rate and high death rate
High birth rate and/or low death rate
Low birth rate and/or high death rate
What is the unit of measurement for population density?
people per square mile
persons per square kilometer
inhabitants per square kilometer
individuals per square meter
What are the factors that influence population growth rate?
birth rate, death rate, immigration, and emigration
food availability, healthcare facilities, social factors
climate change, economic growth, education level
government policies, natural disasters, technological advancements
What is the difference between arithmetic and physiological population density?
Arithmetic population density is calculated by dividing the total population by the total land area, while physiological population density is calculated by dividing the total population by the total arable land area.
Arithmetic population density is calculated by dividing the total population by the total urban land area.
Physiological population density is calculated by dividing the total population by the total urban land area.
Arithmetic population density is calculated by dividing the total population by the total area of a country.
What are the advantages of a population pyramid?
A population pyramid shows the average income of a population.
A population pyramid helps predict future population growth.
A population pyramid indicates the level of education in a population.
A population pyramid provides a visual representation of the age and gender distribution of a population.
What are the limitations of a population pyramid?
1) It provides an accurate representation of the population at all times, 2) It considers migration and changes in population over time, 3) It accurately represents the age distribution without any errors
The limitations of a population pyramid include: 1) It only provides a snapshot of the population at a specific point in time, 2) It does not account for migration or changes in population over time, 3) It may not accurately represent the age distribution due to underreporting or inaccurate data, and 4) It does not consider other demographic factors such as gender or socioeconomic status.
The black rhinoceros is a mammal found in Africa. Weighing in at up to 1,350 kg, these rhinos can live roughly 35 years. Gestation in the black rhino lasts for 15-16 months, with calves staying under the mother’s parental care for up to four years.
Black rhinos have been hunted extensively by humans for their horns. Poaching pressure has reduced the black rhino population to an endangered level. Ongoing efforts are attempting to save the animal from extinction.
How can the black rhino survivorship strategy be categorized?
K-selection, type I
K-selection, type III
r-selection, type I
r-selection, type III
In 1976, the dominant finch on Daphne Major in the Galapagos Islands was the medium ground finch, with a population of 1,200. In 1977, a drought struck the island negatively affecting most of the vegetation. As a result, the population of medium ground finch dropped to 180 due to starvation. In 1983, however, a large amount of rainfall fell on the island creating optimal conditions for vegetation. The medium ground finch population increased to 1,100. What type of factor affected medium ground finch populations in 1977 and 1983?
Density independent
Logistic
Density dependent
Biotic
In 1976, the dominant finch on Daphne Major in the Galapagos Islands was the medium ground finch, with a population of 1,200. In 1977, a drought struck the island negatively affecting most of the vegetation. As a result, the population of medium ground finch dropped to 180 due to starvation. In 1983, however, a large amount of rainfall fell on the island creating optimal conditions for vegetation. The medium ground finch population increased to 1,100. After the rainfall of 1983, what type of population growth did the medium ground finch experience?
Logistic
Quantitative
Exponential
Abiotic
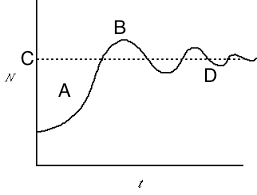
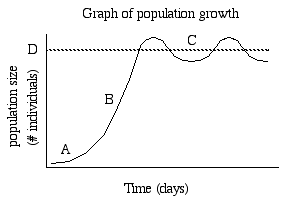
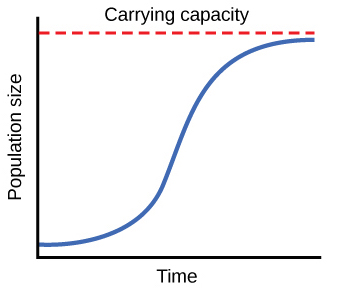
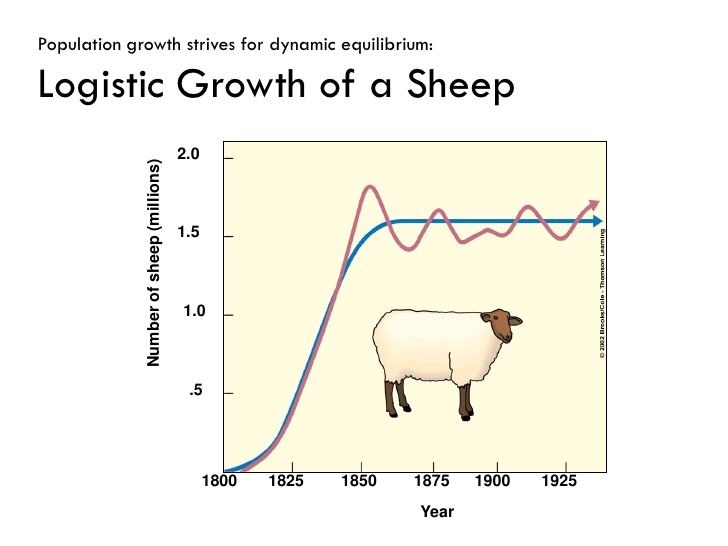
If the population maintains the current growth pattern, a plot of its growth would resemble which of the following?
Which best describes an organism that fertilizes externally?
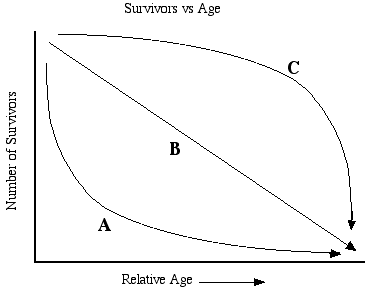
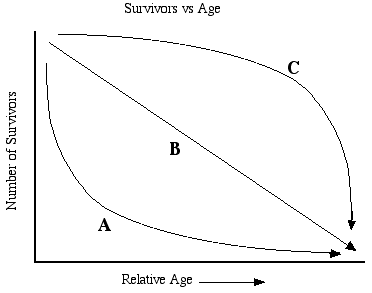
Which curve best describes an organism that invests a lot of energy in parenting?
A certain population of mice is growing exponentially. The growth rate of the population (r) is 2.0 and the current population size (N) is 2,500 individuals. How many mice are added to the population each year?
1250
2500
500
5000
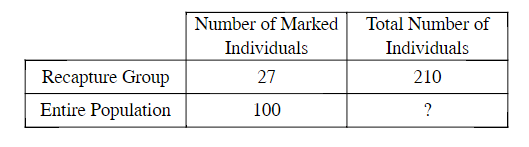
Researchers used the mark-recapture method to estimate the number of individuals in a population. Using the results presented in the table below, estimate the total number of individuals in the population. Give your answer to the nearest whole number.
500
665
778
889
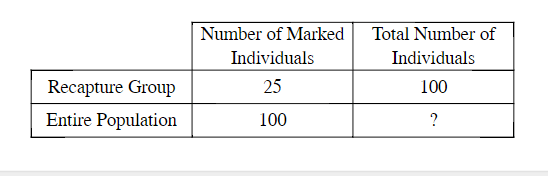
Researchers used the mark-recapture method to estimate the number of individuals in a population. Using the results presented in the table below, estimate the total number of individuals in the population. Give your answer to the nearest whole number.
50
250
400
450
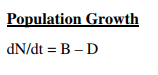
There are 300 falcons living in a certain forest at the beginning of 2013. Suppose that every year there are 50 falcons born and 30 falcons that die.
What is the population growth rate (include units)? Interpret the value.
100
50
20
10
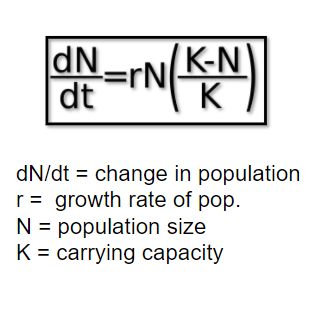
If a population has a carrying capacity (K) of 1000, and the growth rate (r) is 1.1, what is the population growth when the population (N) is 500?
147
227
337
1124
If a population has a carrying capacity (K) of 1000, and the growth rate (r) is 1.05, what is the population growth when the population (N) is 500?
263
563
456
1142

The approximate population of the world today is..
7.6 Million
6.7 Billion
6.7 Million
7.6 Billion
What is the world's most populous country?
India
China
U.S.
Mexico
Which of the following is the world's fastest growing country?
India
China
U.S.
Mexico
One reason the world is growing so quickly is because...
The world has infinite resources for everyone
Birth rate is higher than death rate
There are more and more places for people to live
Death rate is higher than birth rate
The average number of people per square mile is...
Birth rate
Land area
Population density
too many
Most of the world's population lives in...
North America
Europe
Africa
Asia
People leaving a country is called
Immigration
Emigration
Mass migration
Urbanization
A person forced to flee their country due to war, violence, or natural disaster is called a...
Immigrant
A runner
Refugee
An illegal alien
Things that attract people to a new place are called
Push factors
Pull factors
An example of a pull factor is...
A natural disaster
Lack of access to education
Lack of resources
A new job opportunity
Something that makes people want to leave where they are is called a...
Push factor
Pull factor
An example of a push factor is...
A new job
A better school
Natural disaster
Better health care
The movement of people from rural areas into cities is called..
Industrialization
Urbanization
Globalization
City moving

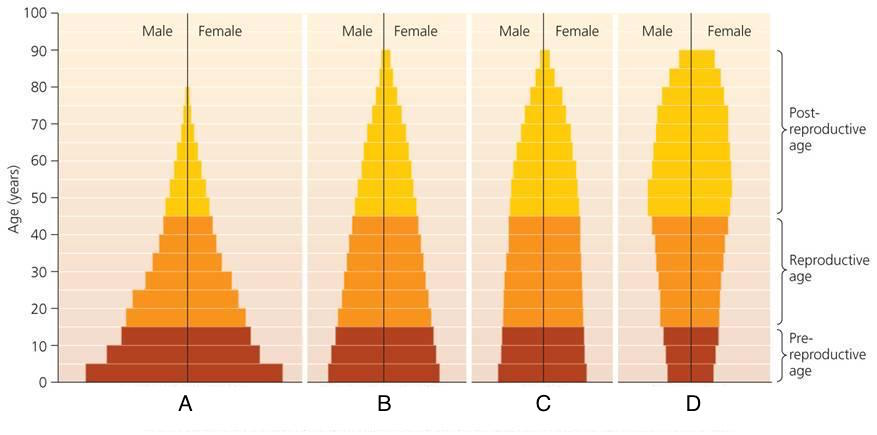
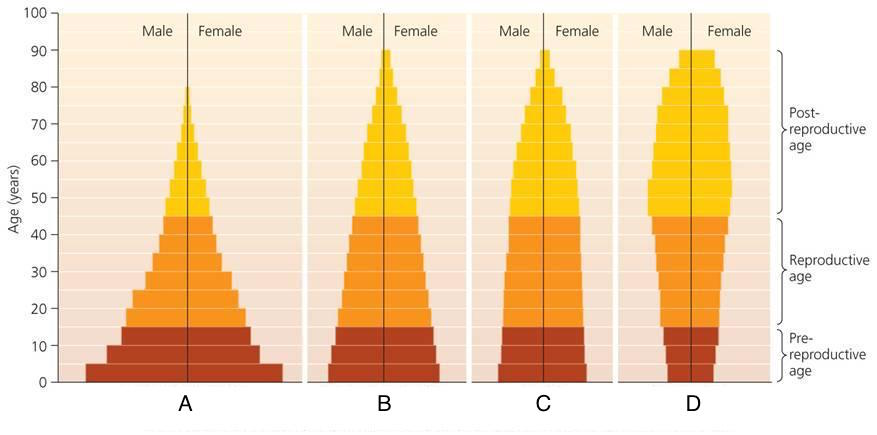
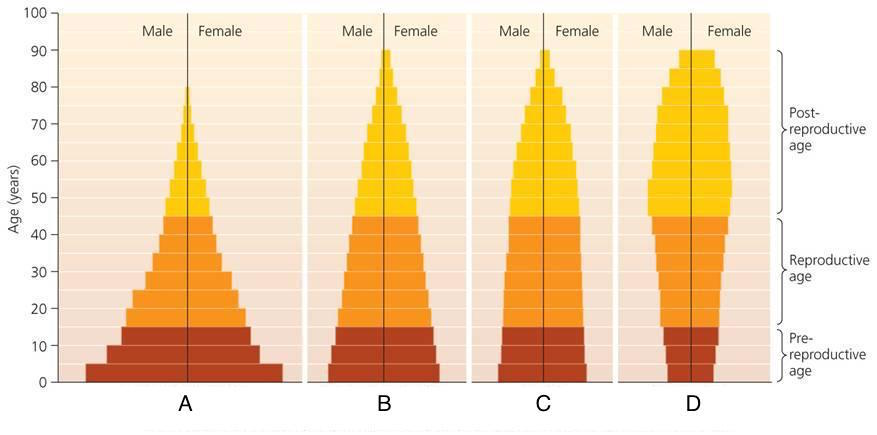
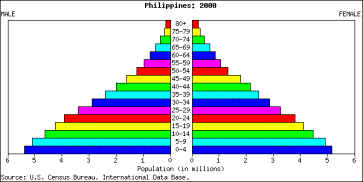
This population pyramid shows...
Rapid growth
Slow growth
Negative growth

This population pyramid shows...
Rapid growth
Slow growth
Negative growth

This population pyramid shows...
Rapid growth
Slow growth
Negative growth
Countries with a rapidly growing population are..
Developed
Developing
All of the following are characteristics of a developing countries EXCEPT...
A large rural population
A low life expectancy
Lack of access to education
Advanced technology
A country with slow or negative growth is usually...
Developed
Developing
All of the following are characteristics of a developed country EXCEPT...
A large urban population
A large rural population
Access to education
Advanced technology

exponential growth curve
logistic growth curve

b
exponential growth
growth slows
growth stops
growth begins

logistic growth curve
exponential growth curve
Logistic population growth can be described as
growth when resources are limited
a s-shaped curve
reaching carrying capacity
all of the above

Which country will have the most rapid population growth?
Sweeden
United States
Mexico
None

What age groups does the bottom of a population pyramid represent?
The elderly
The working adults
The children
Males

What does the whole right side of the population pyramid represent?
Males
Females
Unemployed
Young people

What age group does the top of the population pyramid represent?
The working people
The rich people
The elderly
The young people

What growth rate does this population pyramid represent?
Rapid Growth
Slow Growth
Negative Growth
Zero Growth
Lower birth rate
More developed
Less developed
More people living in poverty
More developed
Less developed

Is this country Developed or Developing?
Developed
Developing

Predict the future population growth of this country.
Negative Growth (the population will shrink)
Slow/No Growth (the population will stay about the same)
Growth (the population will definitely grow)
Fast Growth (the population will explode)

Predict the future population growth of this country.
Negative Growth (the population will shrink)
Slow/No Growth (the population will stay about the same)
Growth (the population will definitely grow)
Fast Growth (the population will explode)

Which country, A or B, has an ageing population?
A
B

The age group that provides the most support for the other groups is:
Young population
Working population
Old population

Which growth rate does this population pyramid represent?
Slow Growth
Zero Growth
Rapid Growth
Negative Growth

Based on this country's population pyramid, their population is
Increasing
Stable
Decreasing

Based on this country's population pyramid, their population is
Increasing
Stable
Decreasing
How is Rate of Natural Increase determined?
birth rate minus death rate
subtract last year’s population from this year’s population
it depends on the stage of the demographic transition a country is in


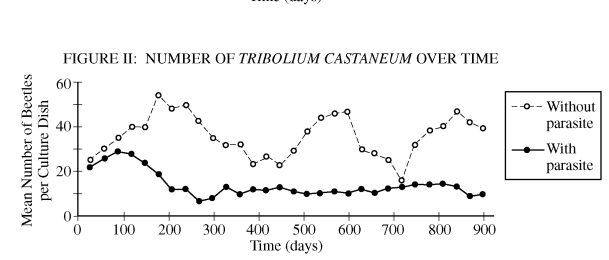
This graph shows ....
When one population increases, the other decreases.
When one population decreases, the other increases.
When one population increases, the other increases instantly.
When one population increases, it causes the other to increases shortly after.


True or False: On a population pyramid, the oldest people are at the bottom.
(a)
What information can be found along the horizontal axis (bottom) of a population pyramid?
Title
Population
Age Group
Gender
What information can be found along the vertical axis (middle or sides) of a population pyramid?
Title
Population
Age Group
Gender
A population pyramid that shows rapid growth will have what type of shape?
a narrower middle and wide bottom
almost equal at middle and bottom
narrower at bottom than middle
A population pyramid that shows slow or stable growth will have what type of shape?
a narrower middle and wide bottom
almost equal at middle and bottom
narrower at bottom than middle
A population pyramid that shows negative or declining growth will have what type of shape?
a narrower middle and wide bottom
almost equal at middle and bottom
narrower at bottom than middle

3. The population pyramid of Japan shows two bulges. What age groups make up those bulges?
35-39 and 60-64
25-29 and Over 80
50-54 and 0-4
30-34 and Over 80

How would you describe the population of this country?
They are experiencing stable population growth
They are experiencing negative population growth
They are experiencing rapid population growth

Describe the healthcare of this country.
Good healthcare available to most
Good healthcare available to some
Poor healthcare for all
Poor healthcare for most

Describe the literacy rate of this country.
Most people can read and write.
Some people can read and write.
Most people can not read and write.
Chinese anti-natalist that began in 1972. Encouraged people to marry later in life, wait longer between children, and have fewer children. It was working, but at a slow pace.
Demographic Transition Model
Epidemiological Transition Model
Later, Longer, Fewer
One Child Policy
Chinese anti-natalist that restricted the number of children Chinese families could have. It ended in 2016 and created a gender imbalance in the Chinese population.
Demographic Transition Model
Epidemiological Transition Model
Later, Longer, Fewer
One Child Policy
The generation after a population spike that results in lower birthrates.
Baby Boom
Baby Bust
Echo Generation
Birth rates spiking in a population, typically after a war.
Baby Boom
Baby Bust
Echo Generation
Shows the typical stages of population change that countries experience as they modernize.
Demographic Transition Model
Epidemiological Transition Model
Malthusian Theory
Thomas Malthus concluded that
population increased geometrically while food production increased arithmetically
the world's rate of population increase was higher than the development of food supplies
moral restraint was producing lower crude birth rates
population growth was outpacing available resources in every country
both A and B
The lowest natural increase rates are found in countries in which stage of the demographic transition?
stage 1
stage 2
stage 3
stage 4
stages 1 and 2

In Stage 1, the birth rate is...
High
Falling
Low

In Stage 1, the death rate is...
High
Falling
Low

In Stage 1, the Total Population is...
Growing slowly
Growing quickly
Decreasing

In Stage 2, the birth rate is...
High
Falling
Low

In Stage 2, the Death rate is...
High
Falling Quickly
Low

In Stage 3, the Birth Rate is...
High
Dropping quickly
Low

In Stage 3, the Death rate is...
High
Dropping slowly
Low

In Stage 3, the Total Population is...
Growing quickly
Slowing down
Decreasing

In Stage 4, the Birth rate is...
High
Rising
Low

In Stage 4, the Death rate is...
High
Rising
Low

In Stage 4, the Total Population is...
Growing Quickly
Leveling Out
Decreasing Quickly
Which describes the birth and death rate of Stage 1 of the DTM?
The death rate is high but the birth rate is low
Both the death and birth rate are high
The death rate is low but the birth rate is high
Both the death and birth rate are low
Which describes the birth and death rate of Stage 2 of the DTM?
The death rate is decreasing and birth rate remains high
Both the death and birth rate are high
The death rate is low but the birth rate is high
Both the birth rate and death rate are decreasing
Which describes the birth and death rate of Stage 3 of the DTM?
The death rate is decreasing and birth rate remains high
Both the death and birth rate are high
The death rate is low but the birth rate is high
Both the birth rate and death rate are decreasing
Which describes the birth and death rate of Stage 4 of the DTM?
The death rate is decreasing and birth rate remains high
Both the death and birth rate are high
Both the death and birth rate are low and fluctuating
Both the birth rate and death rate are decreasing
Which of these does the DTM not include?
Birth rate
Population
Migration
Death rate
In which stage would it be typical for vaccines and healthcare to be adequate?
1
2
3
4
5
Modern belief that there are not enough resources to support a rapidly growing population
Epidemiological Transition
Demographic Transition Model
Malthusian Theory
Neo-Malthusian
Belief that the linear increase in food production will not be able to keep up with rapid exponential population growth, leading to a point of crisis; proved wrong by advances of the 2nd & 3rd Agricultural Revolutions
Epidemiological Transition
Demographic Transition Model
Malthusian Theory
Neo-Malthusian
What does the Demographic Transition model help explain?
Rise and fall of natural increase over time
Rise and fall of immigration over time
Rise and fall of emigration over time
Rise and fall of resources over time
Which of the following is true about stage 2 of the demographic transition model? (Select all that apply)
It is considered high growth
It is considered low growth
Has rapidly declining death rates
High birth rates
High natural increase
Which of the following is true about stage 1 of the demographic transition model? (Select all that apply)
It is considered low growth
Has high birth and death rates
Is considered moderate growth
No long term natural increase
Which of the following is true about stage 3? (Select all that apply)
It is considered moderate growth
Moderate natural increase
Crude Birth Rate is lower than Crude Death Rate
Crude Birth Rate is higher than Crude Death Rate
What is true about stage 4 of the demographic transition model? (Select all that apply)
Has Low growth
Zero Population Growth
Low CBR and CDR
Population change is due to Immigration
Which of the following is true about stage 5? (Select all that apply)
High CBR
Increasing CDR
Negative natural increase rate
Low CBR
Natural (a) happens when the birthrate is higher than the deathrate
Healthcare is more high tech and advanced in this stage and people are educated better about healthier diets and lifestyles.
stage 1
stage 2
stage 3
stage 4
stage 5
Give two reasons why the death rate is high in stage 1
high GNI
Poor access to education
Poor access and quality of healthcare and sanitation
Good access and quality of sanitation
Why would industrialisation reduce the birthrate in a country? One answer is not correct - which one?
people work in factories so smaller families are needed
less children are needed to work on farms
less children die at a younger age
people live in cities with better paid jobs with more reliable pay
Name the development indicator which is not found in the DTM.
Life expectancy
death rate
birth rate
Which describes the birth and death rate of Stage 1 of the DTM?
The death rate is high but the birth rate is low
Both the death and birth rate are high
The death rate is low but the birth rate is high
Both the death and birth rate are low
In which stage of the DTM is the population growth the most rapid?
1
2
3
4
5
Which describes the birth and death rate of Stage 2 of the DTM?
The death rate is decreasing and birth rate remains high
Both the death and birth rate are high
The death rate is low but the birth rate is high
Both the birth rate and death rate are decreasing
Which describes the birth and death rate of Stage 4 of the DTM?
The death rate is decreasing and birth rate remains high
Both the death and birth rate are high
Both the death and birth rate are low and fluctuating
Both the birth rate and death rate are decreasing
In which stage The health care continues to improve further and the death rate remains low.
1st
2nd
3rd
4th
5th
In which stage there is no natural increase because the birth and death rate are high.
1st
2nd
3rd
4th
5th
In which stage women become educated and more
empowered so the birth rate falls.
1st
2nd
3rd
4th
5th
In which stage the country starts to develop and the
secondary sector grows decreasing the
number of people in farming.
1st
2nd
3rd
4th
5th

Identify the stage.
1st - High Stationary
2nd - Early Expanding
3rd - Late Expanding
4th - Low Stationary
5th - Declining

Identify the stage.
1st - High Stationary
2nd - Early Expanding
3rd - Late Expanding
4th - Low Stationary
5th - Declining

Identify the stage.
1st - High Stationary
2nd - Early Expanding
3rd - Late Expanding
4th - Low Stationary
5th - Declining
What is population growth rate?
The population growth rate is the rate at which the population of a particular area or country fluctuates randomly over a specific period of time.
The population growth rate is the rate at which the population of a particular area or country decreases over a specific period of time.
The population growth rate is the rate at which the population of a particular area or country increases over a specific period of time.
The population growth rate is the rate at which the population of a particular area or country remains constant over a specific period of time.
Define population density.
Population density is the average age of individuals in a given area.
Population density is the total land area of a given population.
Population density is the number of individuals per unit volume.
Population density is the number of individuals per unit area.
What factors affect population distribution?
Education, healthcare, transportation, and infrastructure
Religion, language, and ethnicity
Geographical features, such as mountains and rivers
Climate, resources, economic opportunities, political stability, and cultural factors
What are population pyramids used for?
To visualize and analyze the age and gender distribution of a population.
To analyze the economic status of a population.
To predict future population growth.
To measure the total population of a country.
What is the formula to calculate population growth rate?
Births - Deaths / Total population
(Births + Immigration) - (Deaths + Emigration) / Total population
(Births + Immigration) - (Deaths + Emigration) / Total population + Total population
(Births + Immigration) - (Deaths + Emigration) / Total population
What does a wide base in a population pyramid indicate?
A high proportion of elderly people in the population.
An equal proportion of young and elderly people in the population.
A low proportion of young people in the population.
A high proportion of young people in the population.
What does a narrow top in a population pyramid indicate?
Low birth rate and low death rate
High birth rate and high death rate
High birth rate and/or low death rate
Low birth rate and/or high death rate
What is the unit of measurement for population density?
people per square mile
persons per square kilometer
inhabitants per square kilometer
individuals per square meter
What are the limitations of a population pyramid?
1) It provides an accurate representation of the population at all times, 2) It considers migration and changes in population over time, 3) It accurately represents the age distribution without any errors
The limitations of a population pyramid include: 1) It only provides a snapshot of the population at a specific point in time, 2) It does not account for migration or changes in population over time, 3) It may not accurately represent the age distribution due to underreporting or inaccurate data, and 4) It does not consider other demographic factors such as gender or socioeconomic status.

What is a problem Italy will face in the future?
An increase in population of almost 3 million people
The death rate will increase
Italy will have a high elderly dependency ratio
Italy's fertility will increase

What country is this pyramid likely associated with?
Brazil
Nigeria
Japan
Germany
Qatar

China has a population of over 1.3 billion. Monaco has a population just over 37,000.
Why does Monaco have a HIGHER crude population density than China?
Monaco is more urbanized than China
Monaco is more developed than China
Monaco has more farmers per unit of arable land than China
Monaco has less land area than China

This map shows the global median age of the world's population. Based on the data, which of the following would best explain the population in Sub-Saharan Africa?
Availability of birth control has led to a decrease in birth rates
There are likely very few children in the workforce
There are equal education opportunities for men and women
There is a very high life expectancy
The area will have a long-term supply of abundant labor

Which stage of the Demographic Transition Model reflects a country that has the LARGEST workforce supporting its elderly population?
STAGE 1
STAGE 2
STAGE 3
STAGE 4
STAGE 5

This map shows the population density in China. The darkest areas have the highest population density and the lightest areas the lowest.
What PHYSICAL FEATURE most likely explains the high density in Southeastern China?
The mountains
The desert
The ocean
The rainforest

In Stage 1, the death rate is...
High
Falling
Low

In Stage 1, the Total Population is...
Growing slowly
Growing quickly
Decreasing

The lowest birth rates are found in countries in which stage of the demographic transition model?
Stage 1
Stage 2
Stage 3
Stage 4

Country X has a birth rate of 40 and a death rate of 15. In what stage of the demographic transition model is this country most likely in currently?
Stage 1 - No growth
Stage 2 - High growth
Stage 3 - Moderate growth
Stage 4 - Low growth
How does demographic transition impact health status of a country?
economic growth leads to better healthcare services
when populations grow, more people are likely to be healthy
declining death rates lead to lower birth rates too
a larger population can take better care of its citizens

Using Figure 5–6, describe the type of growth Mexico is experiencing.
Mexico is experiencing a rapid growth rate because there are more children than adults.
Mexico is experiencing no growth because people are living longer.
Mexico is experiencing slowed growth because there are fewer adults.
Mexico is experiencing a rapid decline because there are more children than adults.
What is the main purpose of the one child policy in China?
To prevent a population boom
To increase life expectancy
To improve education and opportunities for women
To promote economic growth
When the environment has reached its human carrying capacity, which of the following
conclusions can be made?
Growth and immigration rate is equal to death and emigration rate.
Growth and immigration rate is less than death and emigration rate.
Growth and immigration rate is greater than death and emigration rate.
Growth and immigration rate is exponential to death and emigration rate.
Which of the following is true of human demographic trends?
In preindustrial societies, birth rates are low and the population grows rapidly.
When the average number of children born to each woman falls, the total population always increases.
When birth rates and death rates are both high, the population grows slowly, if at all.
Death rates rise in the third stage of the demographic transition.
Human activities and natural events can have a large effect on populations, biodiversity and ecosystem processes. How does the growth of the human population into rural areas affect the
environmental quality of the native ecosystem?
Human population growth produces new resources that benefit the native ecosystems.
Human population growth in rural areas help organisms evolve in order to survive in
harsher urban environments.
Human population growth in rural areas creates additional waste that is put back into the
environment and lowers environmental quality.
Human population growth in rural areas creates additional living areas for humans to
populate, which would increase the value of the land.
This stage is characterized by: a low and declining death rate, rapidly decreasing birth rate, and a continued increase in the population.
Stage 1 (Pre-Industrial)
Stage 2 (Transitional)
Stage 3 (Industrial)
Stage 4 (Post Industrial)


A large increase in crop production in developing countries achieved by the use of fertilizers, pesticides, and high-yield crop varieties.
Green Revolution
Blue Revolution
Sustainable Development
Malthusian Theory

The time of intense growth in the worldwide aquaculture industry from the mid-1960s to present.
Blue Revolution
Global Warming
Green Revolution
Globalization

1. In Malthus’ 1798 book suggests there are diminishing returns to and a fixed amount of land. It follows in his argument that growing populations will eventually _____________________________. *
shrink as the land will not produce enough food to support the population’s needs
grow further as people switch from farming to fishing in oceans
stagnate

The length of time an individual is expected to live.
birth rate
death rate
life expectancy

Shows the likelihood of survival at different ages throughout the lifetime of the organism.
life expectancy
death rate
survivorship curve

Which curve is flat at the start, indicating a low death rate in the early and middle stages of life?
Type I
Type II
Type III
Which curve drops sharply at the start, indicating
a high death rate among the young?
Type I
Type II
Type III
Mammals that produce very few offspring, but provide them with good care are examples of which type of curve?
Type I
Type II
Type III
Lizards and rodents that have a death rate that doesn't change over their lifespan are examples of what type of survivorship curve?
Type I
Type II
Type III

