
 Worksheets
BIO2110L Quiz Cumulative Review
Total questions: 44
Worksheet time: 1hrs 10mins
In Inferential Statistics we use__________________________________________.
sample means to predict community guidelines.
sample error to predict future parameters.
sample selection to predict natural selection.
sample statistics to estimate population parameters.
How can variables be classified? What are the 2 types of variables used in statistics?
-Categorical: Nominal & Ordinal
-Numerical: Discrete & Continuous
Quantitative and differential statisitcs, uses one variable continuously.
Providing a thorough qualitiatve description, disregarding percent error.
Modifying the order through statistical means.
In the context of a study/experiment variables can also be classified as...
Continuous and discrete
Numerical and discrete
Explanatory and response
Ordinal and numerical
True or false: Explanatory variable is the variable being affected, whereas the response is the variable causing an effect.
TRUE
FALSE
There are many ways to plot data points in statistics, how do we select a graph to use to plot data?
Data means and statistics
Number of variables and Data types
Data values and regression lines
Linear correlations and regression lines
True or False:
Frequency is a variable that can be commonly represented on the y-axis.
TRUE
FALSE
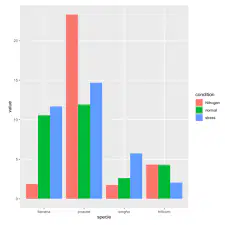
This plotted data set represents what type of data table?
Histogram
Contingency Table
Grouped Bar Plot
Bar Plot

What type of data table is used to display this data set?
Histogram
Contingency Table
Bar Plot
Grouped Bar Plot
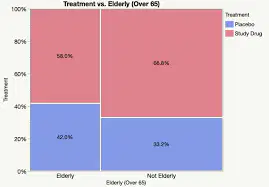
What type of graph is used to display this data set?
Contingency Table
Grouped Bar Plot
Histogram
Mosaic Box Plot
When creating a scatterplot to go alone with a simple linear regression analysis
Def not this one
predictor variable = Y axis, response variable = X axis
predictor variable = X axis, response variable = Y axis
Trick question, only one variable is used

View image!
Numerical - discrete
Categorical - nominal
Numerical - ordinal
Categorical - ordinal
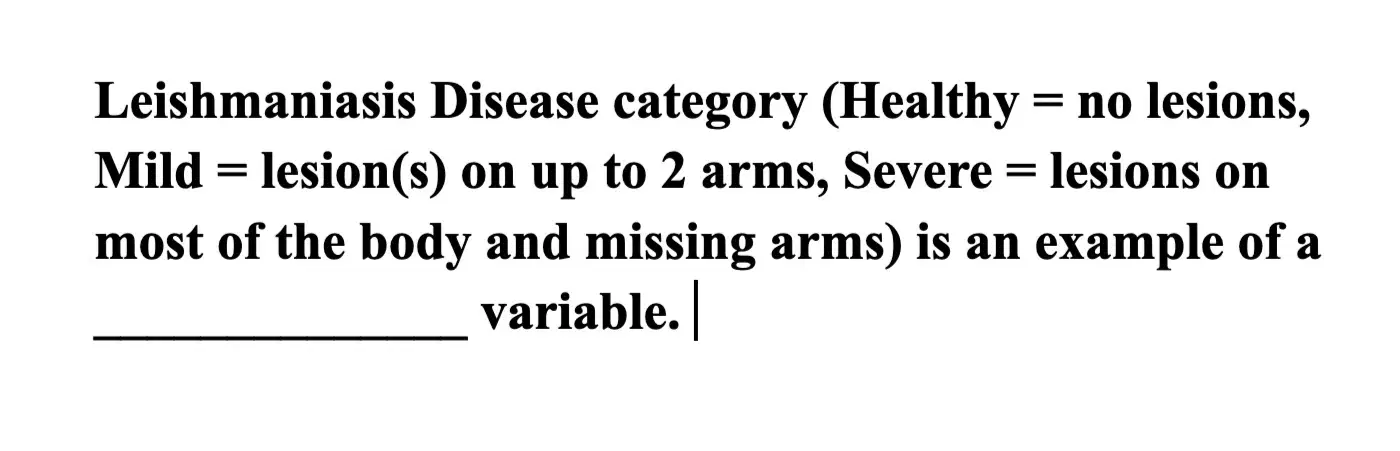
View Image!
Numerical - continuous
Parameter
Distance
Categorical discrete
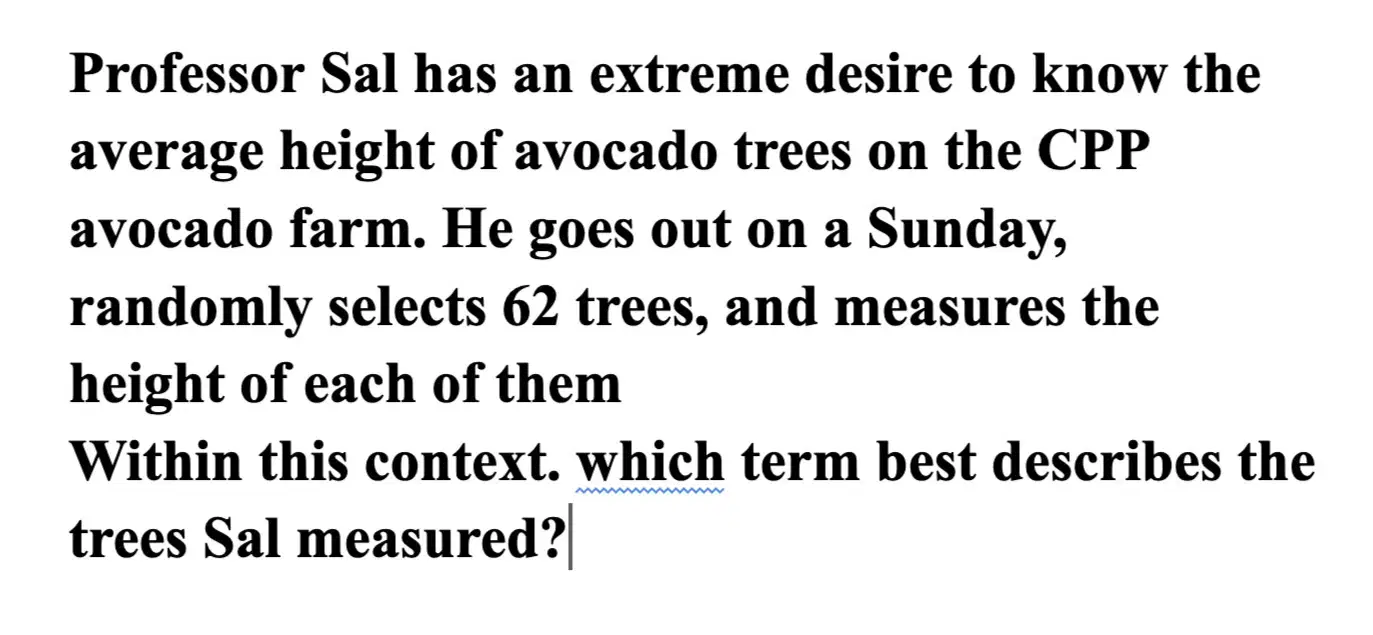
READ!
Parameter
Numerical discrete
Statistics
Numerical ordinal
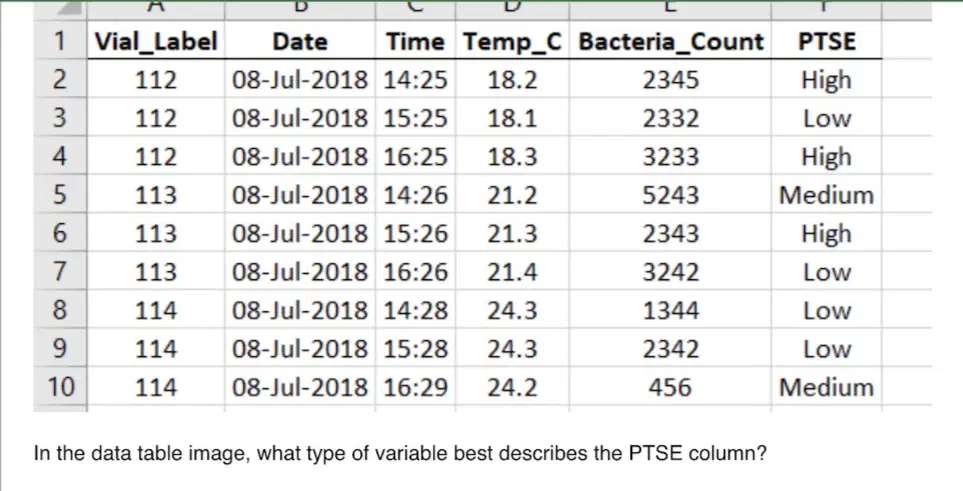
View Image!
Categorical - ordinal
Categorical - nominal
Numerical - discrete
Categorical - continuous
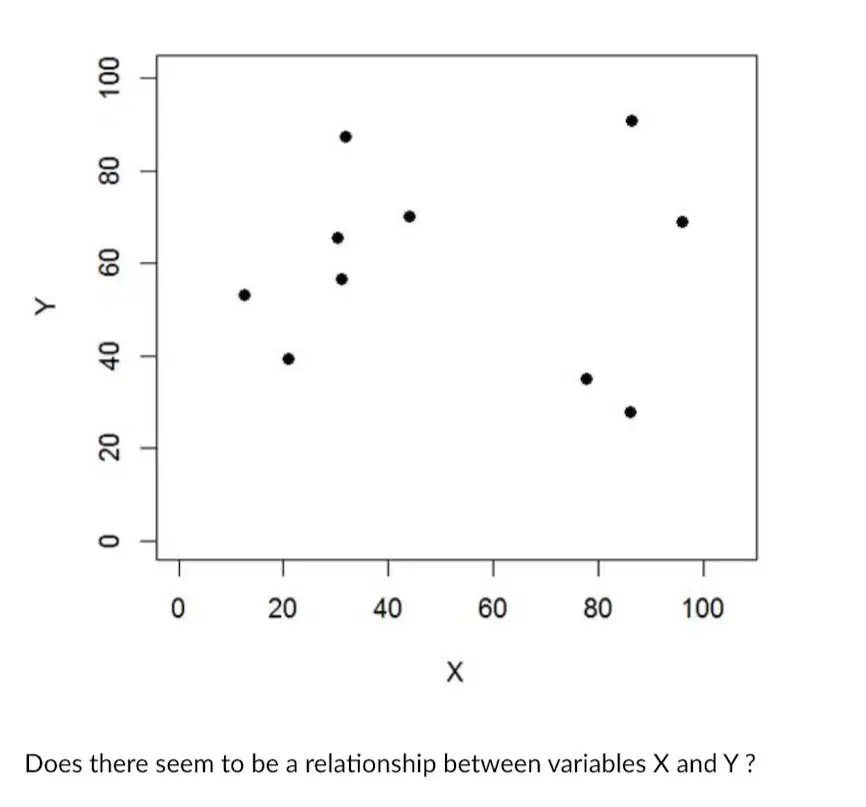
View Image!
NO
YES
An example of a numerical - discrete variable is
A range of discrete responses
Quantitative ordinal variables
Names of butterflies
Count of butterflys at Baddies East
An example of a numerical - discrete variable is
Number of fish counted in tide pool
Volume (L) ot seawater within a tide pool
Relative size of tide pool (small, medium, large)
Measures the association (relationship) between two numerical variables
r, Correlation
Regression
line equation + R2
Measures how much one variable (response) changeswith another variable (explanatory)
Regression, line equation + R2
r, Correlation
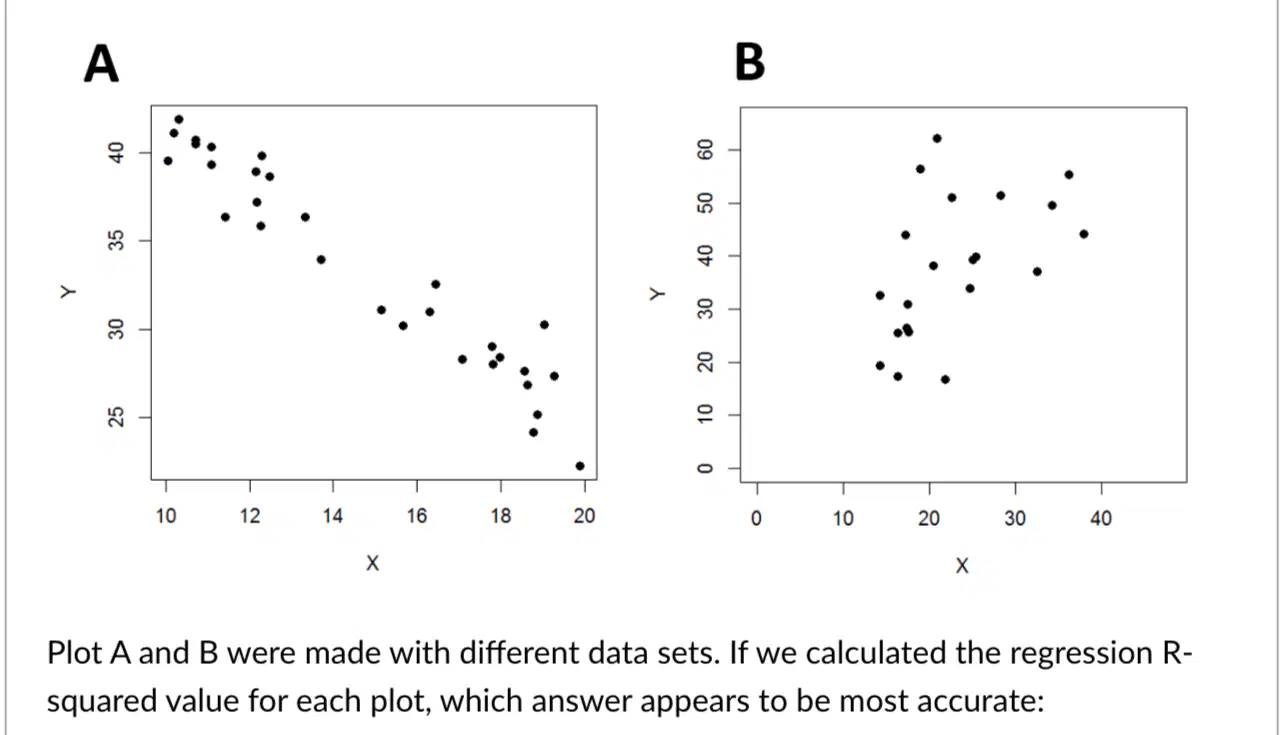
View Image!
A: -0.54, B: 0.42
A: 0.87, B: 0.32
A: -0.87, B: 0.32
A: 0.54, B: 0.42
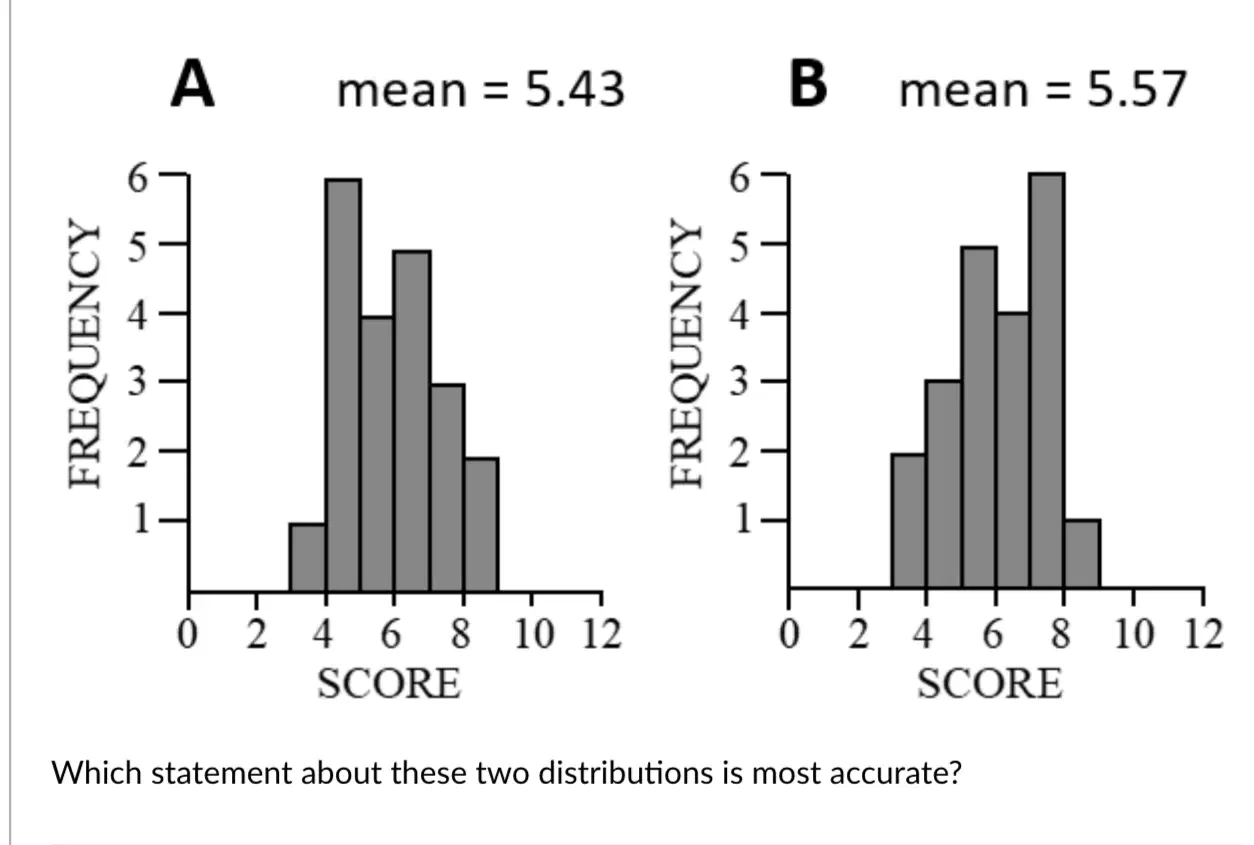
View image!
A retains a lower central tendency, while B has the most spread because of its higher mean
A has a higher central tendency than B because of there mean differences
A has a lower central tendency, while A and B have the same spread
A and B have the same central tendency, but A has lower spread
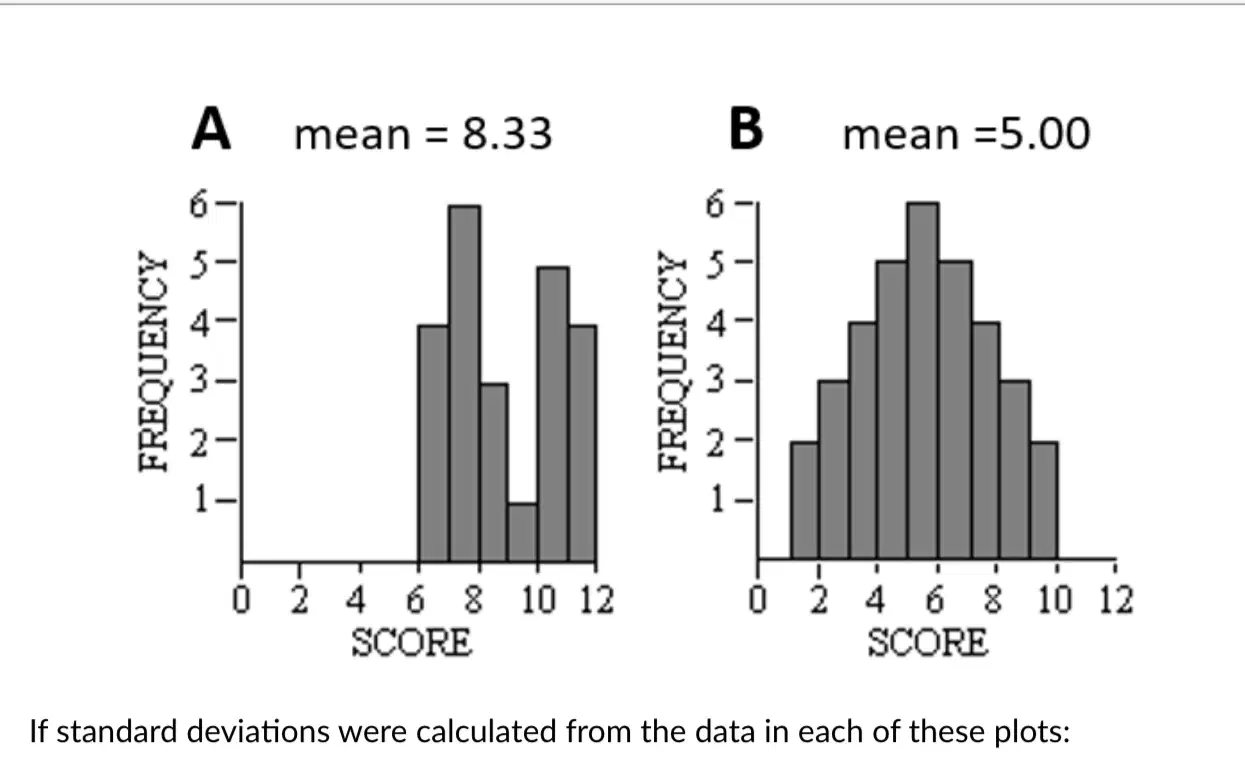
View Image!
The Standard Deviations for both A and B are the same.
The Standard Deviation for B would be larger.
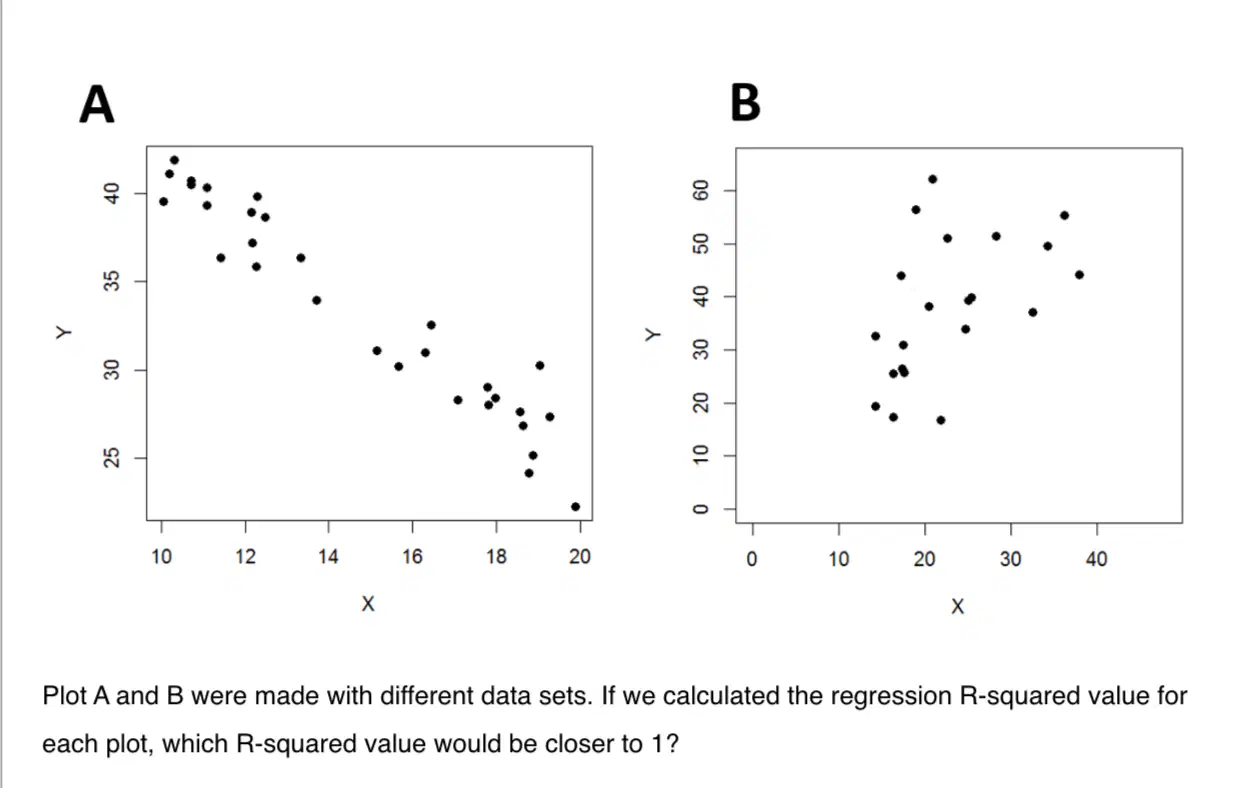
View Image!
Plot A
Plot B

View Image!
Categorical - nominal
Numerical - discrete
Numerical - continuous
Categorical - ordinal

View Image!
Numerical - discrete
Numerical - continuous
Categorical - ordinal
Categorical - nominal
An increase in the sample size will most likely __________.
Increase the standard error
Decrease the standard error
Alters the spread and variability of the population distribution in your matrix.
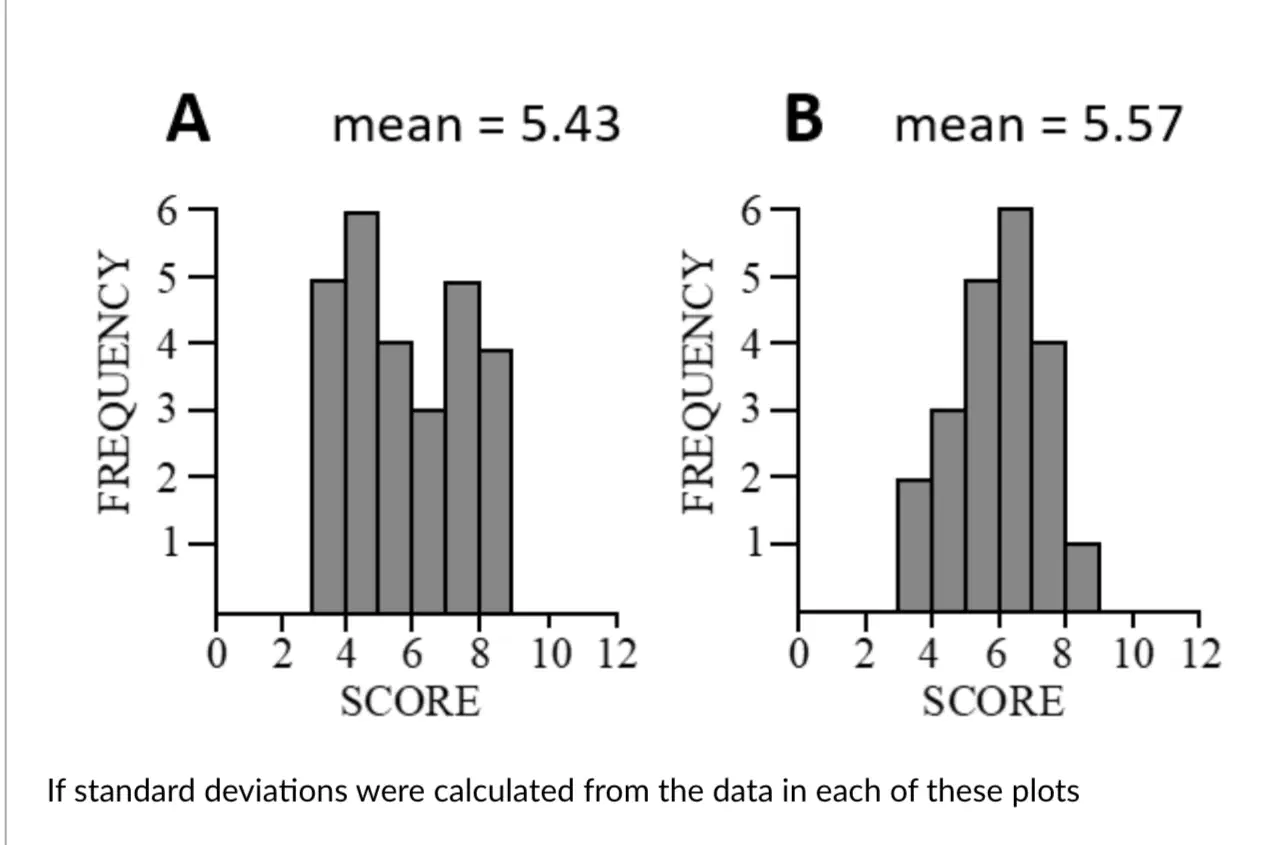
View image!
The standard deviation for B would be larger
The standard deviation for A would be larger
The standard deviation woud remain the same for A and B

View Image!
Plot A
Plot B
Trick question, both A and B are the same
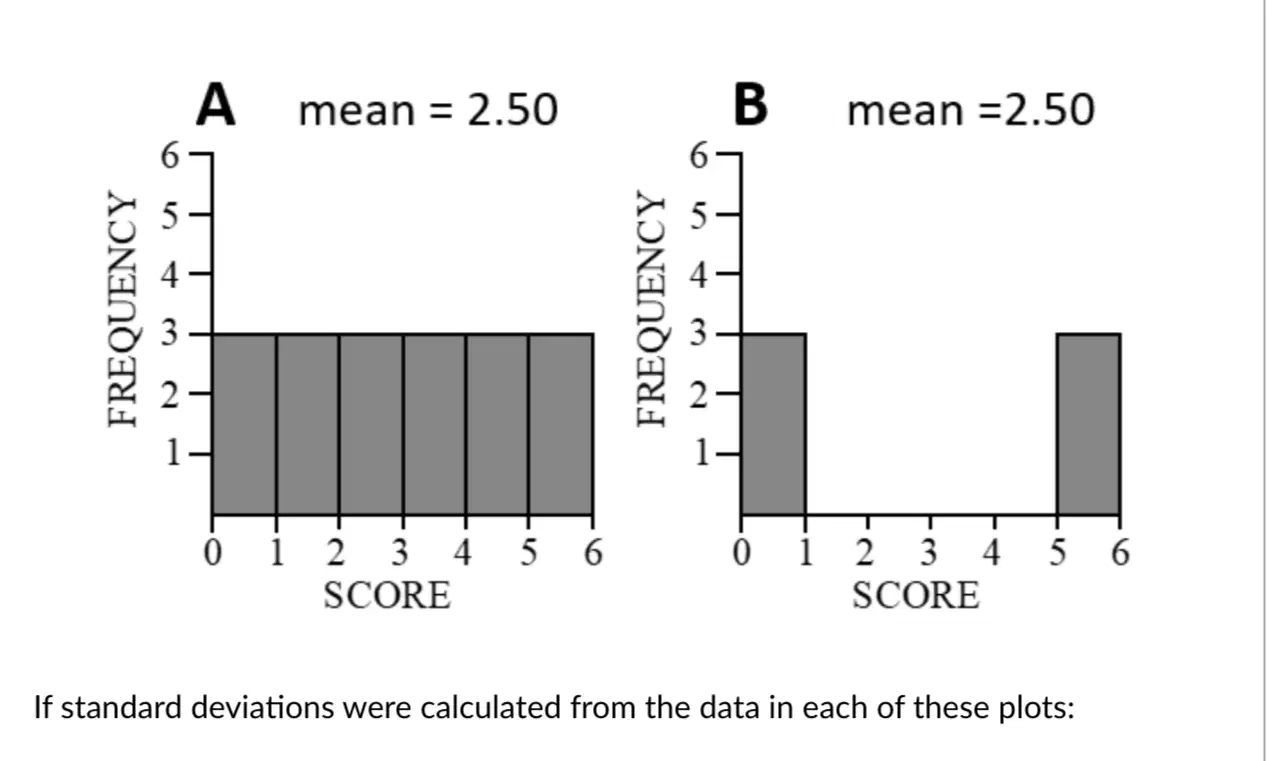
View Image!
The standard deviation for B would be larger bc theres more spread.
The standard deviation for A would be larger bc there's bigger spread.
Trick question, they are the same.
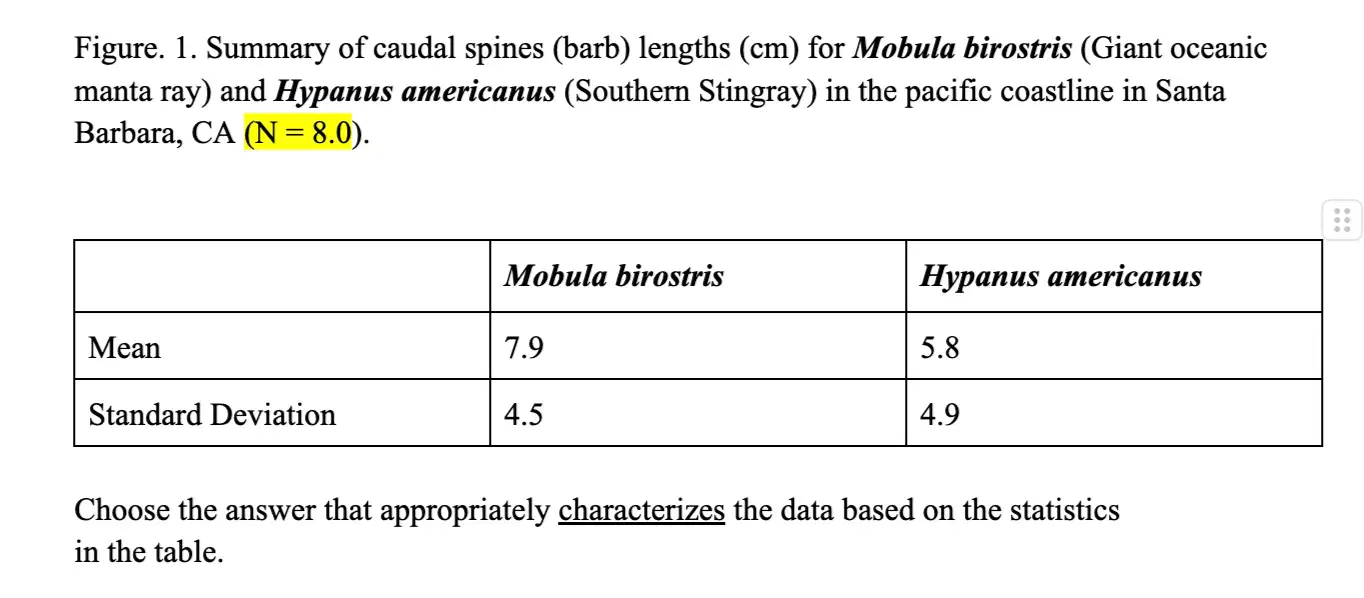
View image!
The lengths of Hypanus americanus barbs are more variable than Mobula birostris barb lengths.
The lengths of Mobula birostris barbs are more variable than Hypanus americanus barb lengths.
The lengths of Mobula birostris barbs provide a bigger spread than Hypanus americanus barb lengths.
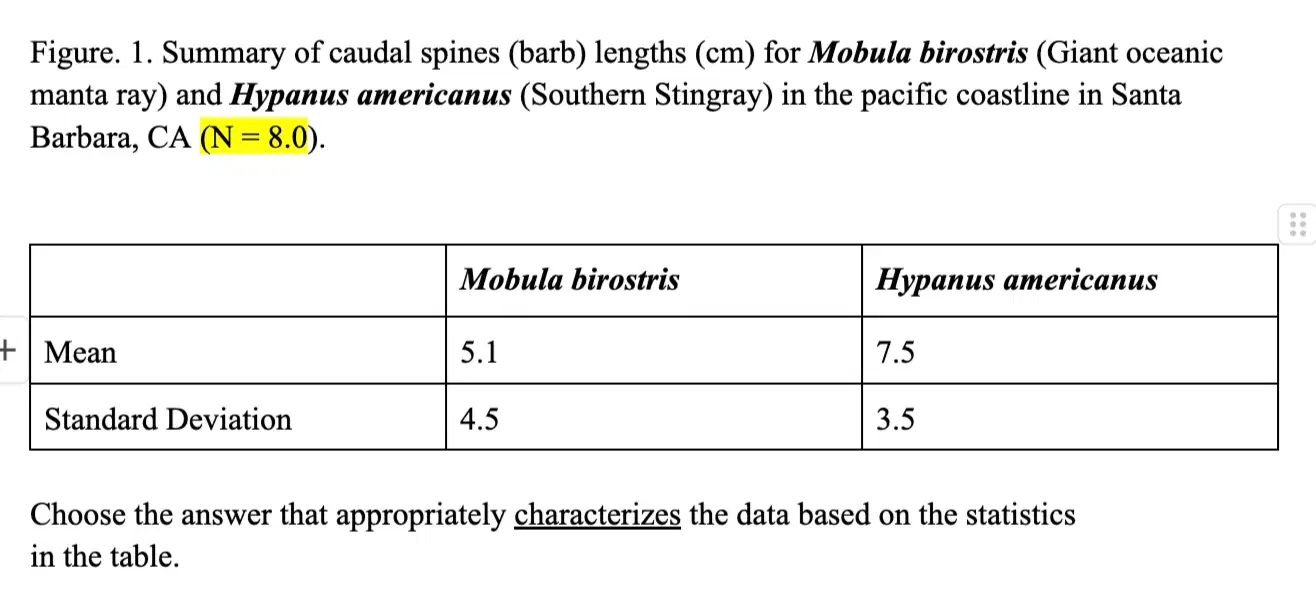
View image!
The lengths of Mobula birostris barbs provide a bigger spread than Hypanus americanus barb lengths.
The lengths of Hypanus americanus barbs are less variable than Mobula birostris barb lengths.
The lengths of Mobula birostris barbs are less variable than Hypanus americanus barb lengths.
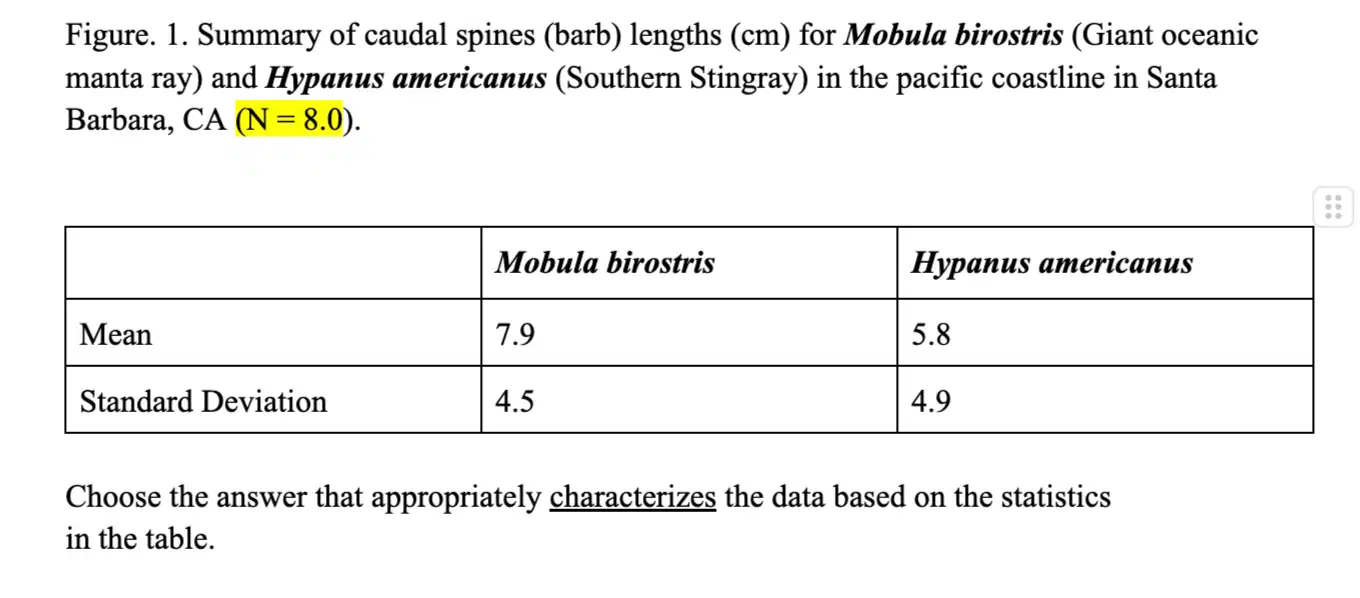
View image!
If you envisioned the distributions of barb lengths (histograms) for each species. the center of the distribution of Hypanus americanus would be shifted to the right of Mobula birostris.
If you envisioned the distributions of barb lengths (histograms) for each species. the center of the distribution of Hypanus americanus would be shifted to the left of Mobula birostris.
If you envisioned the distributions of barb lengths (histograms) for each species. the center
of both the distributions of Mobula birostris and Hypanus americanus would be overlapping each other.
An increase in the sample size will most likely _______.
Decrease the standard error.
Increase the standard error.
change the spread in your population distribution.
When creating a scatterplot to go along with a correlation analysis_______
the dependent variable should be on the × axis and the independent variable should be on the Y axis
the explanatory variable should be on the X axis and the response variable should be on the Y axis.
it makes no difference which variable is plotted on the X or Y axes
A generalized null hypothesis for a two-sample t-test is which of the following?
There is no difference between the mean of samble 1 and 2
The mean of sample 1 and sample 2 are not equal.
The mean of sample 1 and sample 2 are both equal to zero
An independent sampling design is:
one in which a value in one sample is biologically associated with only one value in
anorner sample
one in which individual values in one sample are not related in any way to specific values in another sample.
one of which multiple values are associated with each other
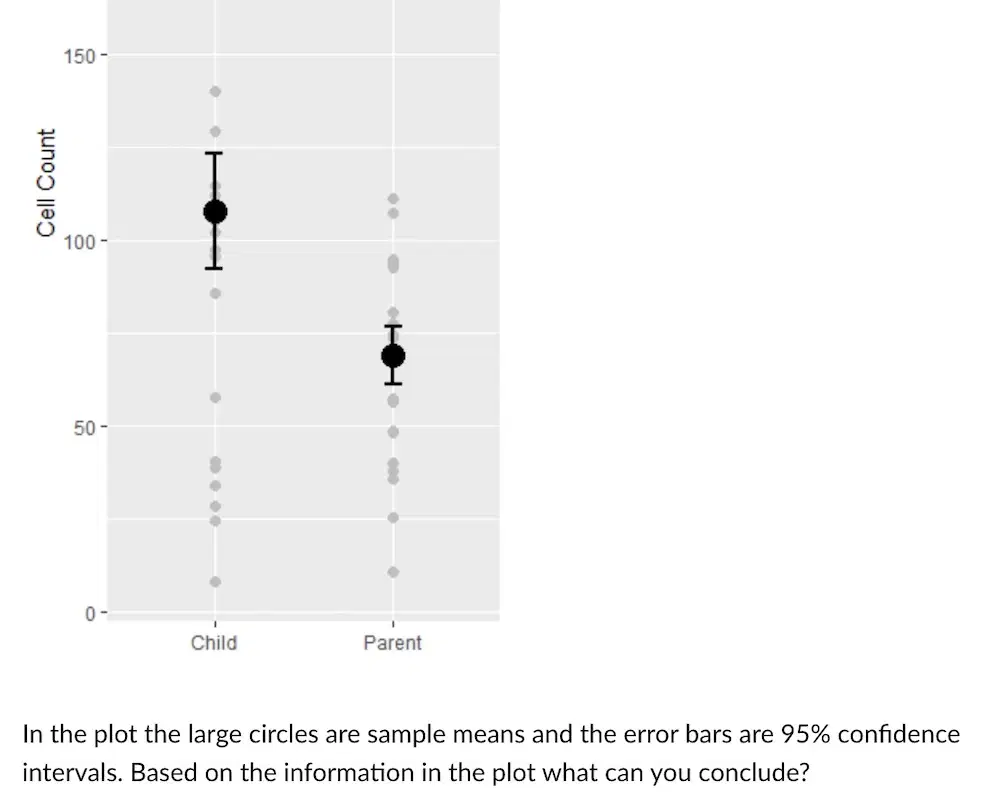
View Image!
Two means are significantly different.
Two means are NOT significantly different.
Results of hypothesis test ARE unclear.
A generalized null hypothesis for a two-sample t-test is which of the following?
There is no difference between the mean of sample 1 and 2.
The mean of sample 1 and sample 2 are both eaual to zero.
The mean of samble 1 and samble 2 are not equal.
What percentage of the population distribution is located within 1 standard deviation (+/-) of the mean? (choose the closest answer)
95
68
99.7
An examble of a numerical - continuous variable is:
The total count of visitors touring Biotrek ONLY on Wednesdays.
Brand of a particular shirt
The average expected number of visitors touring BIotrek
The density of blood in a sample of hypotonic saline IS an example of a _______ variable.
Categorical - nominal
Numerical - continuous
Numerical - discrete
Categorical - ordinal
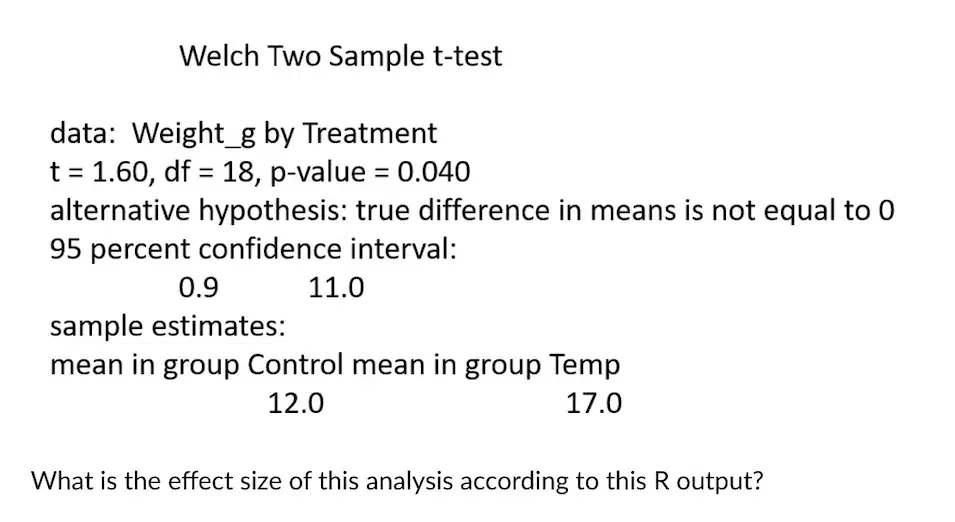
View Image!
That can't be determined from this output.
5
0.04
17
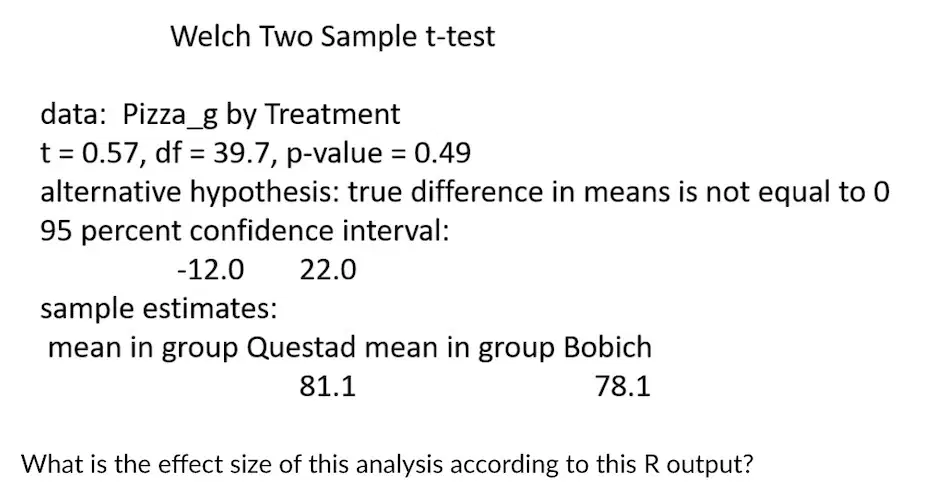
View Image!
22
3
0.49
That can't be determined based on output.
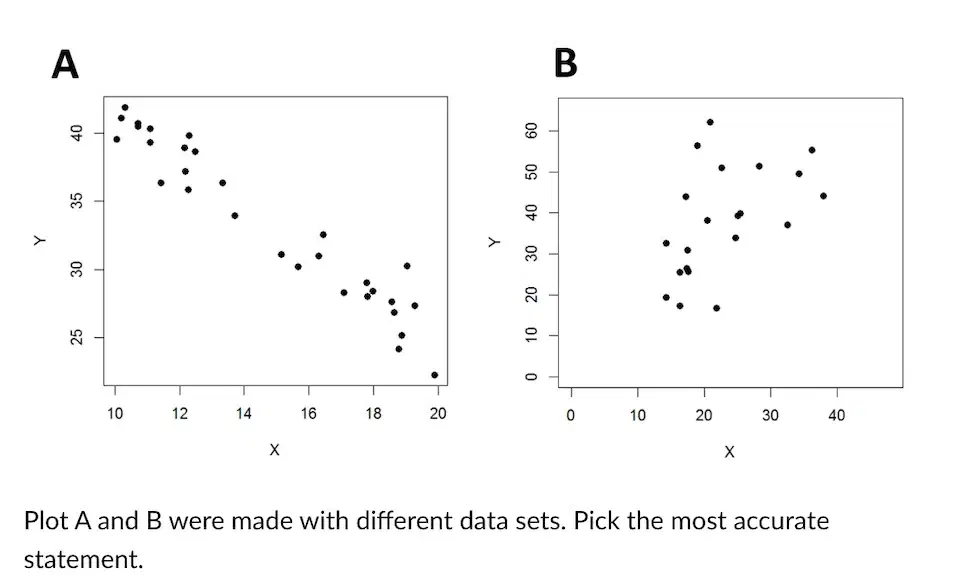
View Image!
Plot A displays a weaker relationship that Plot B
Plot A displays a stronger relationship that Plot B
Trick question, these two graphs are examples of strong relationships, graphed using smaller values
These graphs are not suitable for comparison.

