
 Worksheets
Theory of Demand Quiz (Part 2) Formative Assessment
Total questions: 12
Worksheet time: 6mins
What are the factors affecting the demand for a good?
Shape of the Product
Price of the Product
Color of the Product
Size of the Product
How are price changes illustrated on a demand curve?
Rightward shift of the curve
Leftward shift of the curve
Movement along the curve
Downward shift along the curve
How is an increase in demand illustrated diagrammatically according to non-price changes?
Leftward shift in the Demand Curve
Upward movement along the curve
Rightward shift in the Demand Curve
Downward movement along the curve
How is a decrease in price illustrated on a demand curve?
Rightward shift of the curve
Downward movement along the curve
Leftward shift of the curve
Upward movement along the curve
Which factor does not affect the demand for a good?
Income of consumers
Prices of substitutes and complements
Color of the Product
Tastes/preferences of consumers
The price of a product rises. What will happen to the demand for its complement?
It will contract.
It will extend.
It will decrease.
It will increase.
Which of the following factors is not a cause of change in demand? Changes in
the size of the population
price of the commodity
income distribution
taste and fashion.
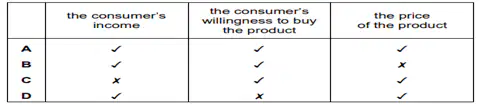
What determines a consumer’s demand for a product based on the diagram?
A
B
C
D
Public transport and cars are substitute goods. The price of public transport rises. What will happen to the demand for cars?
It will contract.
It will extend.
It will decrease.
It will increase.
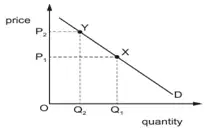
The diagram shows a demand curve.What does the movement from X to Y show?
A decrease in quantity demanded due to an increase in price.
A decrease in quantity demanded due to changes in the conditions of demand.
An increase in quantity demanded due to changes in the conditions of demand.
An increase in quantity demanded due to an increase in price
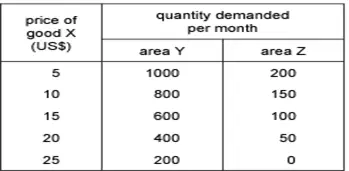
Good X is demanded in two areas, Y and Z. The table shows the amount of X demanded in these areas at different prices. What can be concluded from the table?
Consumers in area Y are more willing and able than consumers in area Z to buy good X.
Consumers in area Y are richer than consumers in area Z.
Consumers in area Y want the good more than consumers in area Z.
There are more consumers living in area Y than in area Z.
How is a decrease in demand represented on a demand curve?
Leftward shift of the curve
Upward movement along the curve
Rightward shift of the curve
Downward movement along the curve

