
 Worksheets
MP4 Nine Week Review
Total questions: 50
Worksheet time: 3hrs 59mins
log4(3x - 1) = log4(2x + 3)
4
3
1
8
log6(2x + 16) = 3
x = 2
x = 116
log8(4x - 4) = 2
18
12
2
5
Solve for x. log52+log5x=log520
x = 20
x = 10
x = 2
x=101
Solve for x. log4(x+3)+log42=4
x = 29
x = 51
x = 4
x = 125

Continue solving for x. Which is the correct "step 2"?
64=x3
643=x
x64=3
364=x

Finish solving for x.
Fill in the blank in the box below
(a)
Solve for x: 9x=60
1.748
x = 6.667
x = 0.537
x = 1.863
Rewrite the equation into logarithmic form:
62 = 36
log6 2 = 36
log6 36 = 2
ln 36 = 2
636 = 2
Rewrite 34 = 81 in logarithmic form.
log3 4 = 81
log81 3 = 4
log3 81 = 4
log4 81 = 3
53 = 125


A
B
C
D
Solve the equation using log properties.
log2(x+1)+log2(x)=1
5
6, 3
−1, 2
−2, 1
Solve log11(3b+2)=log11(b2−8)
b=5, −2
b=3, 7
b= −5, 2
b=4
Solve log4(x2−11x+34)=2
x = 2 and 9
x = 4 and 8
x = 5 and -2
x = -9 and 2
Solve log2(x2−2x+16)=6
x = -6 and 8
x = 4 and -3
x = -6 and -8
x = 7


Select all the transformations that apply.
y = -2 log 1/2 x
Vertical stretch by 2
Vertical shrink by 1/2
Reflection across the y-axis
Reflection across the x-axis

Using the parent function y=log3x what would the graph of y=log3(x+5) look like?
Horizontal shift left 5 units
Horizontal shift right 5 units
Vertical shift up 5 units
Vertical shift down 5 units
Using the parent function
y=log6x what would the graph of y=log6x+9 look like?Horizontal Shift to the right 9 units
Horizontal shift to the left 9 units
Vertical shift 9 units up
Vertical shift 9 units down
Describe the graph of f(x) = log x changed to
f(x) = log(x + 21) - 50
translate right 21 units and 50 units down
translate left 21 units and 50 units down
translate right 21 units and 50 units up
translate left 21 units and 50 units up
What is the change in the graphs from f(x) to g(x)?
Right nine and down seven
Left nine and down seven
Left nine and up seven
Right nine and up seven
Describe the graph of f(x) = log9 x transformed to
f(x) = log9(-x + 1) - 5
Reflection about the y-axis; shift right 1 and 5 down
Reflection about the y-axis; shift left 1 and 5 down
Reflection about the x-axis; shift right 1 and 5 units down
Reflection about the x-axis; shift left 1 and 5 units down


Write the exponential regression equation for the data.
Y=8.16(2.7)x
Y=81.6(2.7)x
Y=8.16(.27)x
Y=8.16(27)x

Which type of regression model does the scatter plot appear to show?
linear
exponential
quadratic

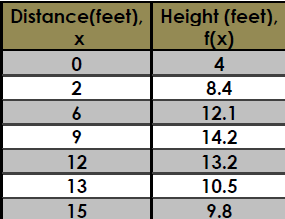
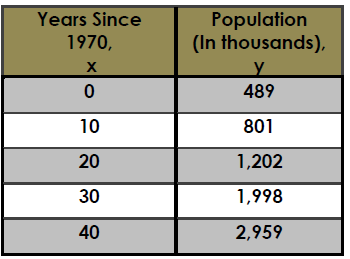


What type of regression would you use for this data?
Quadratic
Linear
Radical
Exponential

What type of regression would you use for this data?
Linear
Quadratic
Radical
Exponential

The number of newly reported crime cases in a county in New York State is shown in the accompanying table, where x represents the number of years since 1994, and y represents number of new cases. Write the linear regression equation that represents this set of data, rounding all coefficients to the nearest hundredth. Using this equation, find the projected number of new cases for 2003, rounded to the nearest whole number.
974
25,101
940
952

What function model best represents the data in the table?
linear
exponential
quadratic

What function best models the data in the table?
linear
exponential
quadratic


This is a _______________ function.
Linear
Exponential
Quadratic

Which kind of function has the same Second Differences
Linear
Quadratic
Exponential
Absolute Value
Which kind of function has the same Common Ratios
Linear
Quadratic
Exponential
Absolute Value
How can you tell if a table represents a linear function?
There is a common difference (constant rate of change)
There is a common SECOND difference
There is a common ratio

