
 Worksheets
Analysis of Sports Involvement and Super Bowl Ticket Prices
Total questions: 10
Worksheet time: 6mins

Mr. Swartzentruber selects a random sample of 100 students in grades 10 through 12 and asks their year in school and whether they were involved in interscholastic sports, intramural sports, or no sports. The results are summarized in the segmented bar graph. What is the explanatory variable and the response variable?
Explanatory: Year in school; Response: Type of sports involvement
Explanatory: Type of sports involvement; Response: Year in school
Explanatory: Number of students; Response: Year in school
Explanatory: Type of sports involvement; Response: Number of students
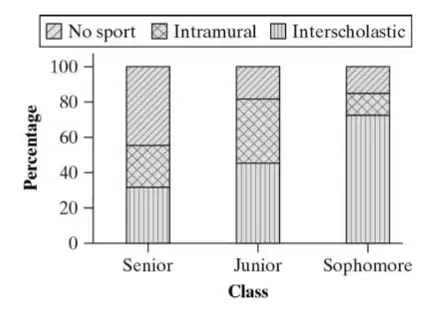
Use the graph of their results to determine if there is an association between year in school and involvement in sports. Explain your answer. If there is an association, briefly describe it.
Yes, there is a strong association.
Yes, there is a weak association.
No, there is no association.
The graph does not provide enough information.
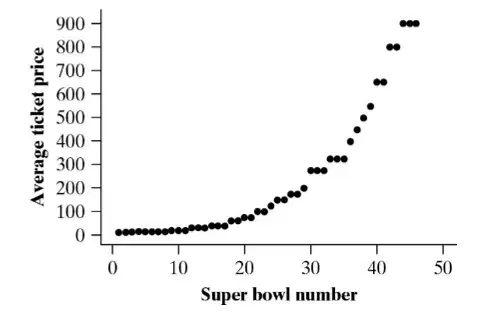
The average price of a Super Bowl ticket in 1967 (Super Bowl 1) was $12. Over time, the price of a Super Bowl ticket has increased considerably. Below is a scatterplot of the average price of a Super Bowl ticket versus the Super Bowl number for the first 46 Super Bowls. What type of relationship is shown in the scatterplot?
Linear increase
Exponential increase
No change
Decrease

For each of the following relationships, is r closer to –1, +1, –0.5, +0.5 or 0?
+1
-1
-0.5
+0.5

For each of the following relationships, is r closer to –1, +1, –0.5, +0.5 or 0?
–1
+1
–0.5
+0.5
0
The correlation between the number of dogs kept as pets in the U.S. and money spent on tennis balls for the past 10 years is r = 0.93. Does the strong correlation between these two variables suggest that having more dogs kept as pets causes people to spend more money on tennis balls?
Yes, a strong correlation always implies causation.
No, correlation does not imply causation.
Yes, because more dogs mean more tennis balls are needed.
No, because the correlation is not strong enough.
The height (in feet) and volume (in cubic feet) of usable lumber of 32 cherry trees are measured by a researcher. The goal is to determine if volume of usable lumber can be estimated from the height of a tree. The correlation between height (in feet) and volume (in cubic feet) for these 32 cherry trees is r = 0.67. Interpret this value.
There is a strong positive correlation between height and volume.
There is a moderate positive correlation between height and volume.
There is a weak positive correlation between height and volume.
There is no correlation between height and volume.
One cherry tree is 65 feet tall and has a volume of 70 cubic feet of usable lumber. How does this tree affect the correlation?
It increases the correlation.
Makes the correlation closer to 0.
It has no effect on the correlation.
It reverses the correlation.
What would happen to the correlation if the volume was plotted on the horizontal axis and height was plotted on the vertical axis?
The correlation would remain the same.
The correlation would become stronger.
The correlation would become weaker.
The correlation would reverse.
Who do you think my Favorite student is?
(a)

