
Font size
 Worksheets
APES Unit 3: Populations Review
Total questions: 69
Worksheet time: 38mins
What is population density?
Population density is the number of individuals per unit area or volume.
Population density is the average age of a population.
Population density is the number of individuals per unit time.
Population density is the total number of individuals in a population.
What is population growth?
Decrease in the number of individuals in a population over time.
The average number of individuals in a population.
The movement of individuals from one population to another.
Increase in the number of individuals in a population over time.
Explain carrying capacity.
The minimum number of individuals an environment can support sustainably.
The average number of individuals an environment can support sustainably.
The maximum number of individuals an environment can support unsustainably.
Maximum number of individuals an environment can support sustainably.
What factors contribute to population growth?
emigration, decreased birth rate, natural disasters
birth rate, immigration, improved healthcare
How does population distribution affect ecosystems?
Population distribution only affects the physical environment of ecosystems.
Population distribution affects ecosystems by determining the availability of resources, competition for those resources, and the overall balance of species within the ecosystem.
Population distribution has no impact on ecosystems.
Population distribution only affects the behavior of individual organisms within ecosystems.
Discuss the concept of carrying capacity in relation to resource availability.
Carrying capacity is the average number of individuals of a species that an environment can sustainably support given the available resources.
Carrying capacity is the maximum number of individuals of a species that an environment can sustainably support given the available resources.
Carrying capacity is the maximum number of individuals of a species that an environment can support regardless of the available resources.
Carrying capacity is the minimum number of individuals of a species that an environment can sustainably support given the available resources.
Give an example of a generalist species.
Polar bear
Raccoon
Panda
Koala
Define carrying capacity.
Maximum population size of a species that the environment can sustain indefinitely
The total area of land available for a species to inhabit
The average number of offspring produced by a species
The number of individuals in a population that exceeds the environment's resources
What are generalist species?
Species that can only survive in a very specific environment
Species that are only found in one location
Species that can thrive in a wide variety of environmental conditions and can make use of a variety of different resources.
Species that can only use one type of resource
Define biodiversity.
The study of rocks and minerals
Number of species in a specific ecosystem
The process of creating new animal species
Variety of life on Earth
A mouse with a short life span, produces more offspring than can survive, and gives little or no parental care is a
R-selected species
K-selected species
An elephant that has only 1 offspring at a time, has a long life span, and provides parental care throughout maturity is a
K- selected species
R-selected species

A pattern of survival over time in which there is high survival throughout most of the life span, but then individuals start to die in large numbers as they approach old age.
Type i survivorship
Type ii survivorship
Type iii survivorship

A pattern of survival over time in which there is a relatively constant decline in survivorship throughout most of the life span.
Type ii survivorship
Type i survivorship
Type iii survivorship

A pattern of survival over time in which there is low survivorship early in life with few individuals reaching adulthood.
Type III survivorship
Type II survivorship
Type I survivorship

This graph represents the _______ growth curve.
Exponential
Logistic

This graph represents a _____ growth curve
Logistic
Exponential
When the exponential growth hits the ecosystems _________ it levels off and changes to logistic growth.
Carrying capacity
substantiated curve
dependent factors
Which would have the lowest survival rate in the beginning, but if it survives to maturity, it can live a long time.
Type III survivor
Oak tree
Elephant
Mockingbird
Organisms adapted to narrow habitats, limited food resources, or other specific environmental conditions.
Specialist
Generalist
These organisms have:
Long life span
Long period of gestation-pregnancy
Long term care of babies until maturity
Have few babies
K-strategist
R-strategist
H-strategist
These organisms have:
Short life span
Short gestation-pregnancy
Very little care for babies
Produce more offspring that can survive
R-strategist
K-strategist
H-strategist
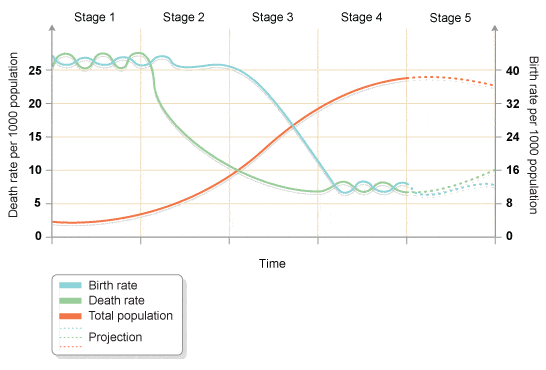
A characteristic of stage Three of the Demographic Transition Model shows?
High birth and death rates
Low death and high birth rates
Declining birth and death rates
High death and low birth rates

A characteristic of stage one of the Demographic Transition Model shows
High birth and death rates
Low death and high birth rates
Low birth and death rates
High death and low birth rates

A characteristic of stage four of the Demographic Transition Model shows
High birth and death rates
Low death and high birth rates
Low birth and death rates
High death and low birth rates

On the Demographic Transition Model, which stage(s) is/are characterized by HIGH death rates, High BIRTH RATES, but LOW populations.
Stage 1
Stage 2
Stage 3
Stages 4 and 5

This country most likely is in which stage of the Demographic Transition Model?
stage 1
stage 2
stage 3
stage 4
What happens to a population with a lack of limiting factors (predators, disease, competition, and other factors that decrease population growth).
Shrinks
Immigration
Indefinite growth
Emigration
When a population has unlimited resources, and it continues to grow to its FULL LIVING POTENTIAL, it is called
Peak
Top shelf
Resource controlled limit
Biotic potential
factors that affect a population depending on its size
- these include food, predation, parasitism, and disease
Density-Dependent factor
Density-Independent factors
affect all populations similarly regardless of population size. Examples include: natural disasters, rapid climate changes (drought or floods), and human activity and disturbances
Density-Dependent factors
Density-Independent factors
Describes how many individuals of different ages make up a population
Age Structure
Age Layout
The youths collation
Age Spread
Which population has the greatest potential for rapid growth?
Populations with a large number of middle aged individuals
Older populations
Populations with large numbers of young offspring
None of these

According to the diagram, squirrels are which type of survivorship curve?
Type I
Type II
Type III
When there is a high survivorship early in life due to high parental care, then a rapid decrease in survivorship in late life as old age sets in, which type of
survivorship?
Type I
Type II
Type III
Type III survivorship curves contain mostly which type of selected species?
K-selected
R-selected
both K and R selected
True or false: Type II is a steadily decreasing survivorship throughout life
True
False

What does the whole right side of the population pyramid represent?
Males
Females
Unemployed
Young people

What age group does the top of the population pyramid represent?
The working people
The rich people
The elderly
The young people

What age groups does the bottom of a population pyramid represent?
The elderly
The working adults
The children
Males

Does this age structure diagram show a country with
Rapid Growth
Decreasing Growth
Zero Growth

Does this age structure diagram show a country with
Zero Growth
Rapid Growth
Decreasing Growth

Does this age structure diagram show a country with
Decreasing Growth
Zero Growth
Which of the following age structure diagrams demonstrates decreasing growth in the population?


none of the above
Which of the following age structure diagrams demonstrates zero growth in the population?
none of the above
Which of the following age structure diagrams demonstrates POSITIVE, RAPID growth in the population?
none of the above

Which country will have the most rapid population growth?
Sweeden
United States
Mexico
None

Which describes the birth and death rate of Stage 1 of the demographic transition model?
The death rate is high but the birth rate is low
Both the death and birth rate are high
The death rate is low but the birth rate is high
Both the death and birth rate are low

Which describes the birth and death rate of Stage 2 of the DTM?
The death rate is decreasing and birth rate remains high
Both the death and birth rate are high
The death rate is low but the birth rate is high
Both the birth rate and death rate are decreasing
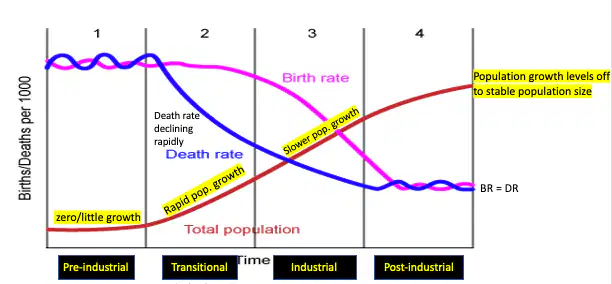
Which describes the birth and death rate of Stage 3 of the DTM?
The death rate is decreasing and birth rate remains high
Both the death and birth rate are high
The death rate is low but the birth rate is high
Both the birth rate and death rate are decreasing

Which describes the birth and death rate of Stage 4 of the DTM?
The death rate is decreasing and birth rate remains high
Both the death and birth rate are high
Both the death and birth rate are low and fluctuating
Both the birth rate and death rate are decreasing
In Stage 1, the Population Pyramid would look like. . .


In Stage 5, the Population Pyramid would look like. . .
A country has begun to get access to health care for women and children and there is better access to food resources and clean water. However, it is still very expensive to get access to reliable birth control so most women do not use it. What stage of the demographic transition is this country likely in?
Stage 1-Pre industrial
Stage 2- Transitional
Stage 3 - Industrial
Stage 4 - Post industrial

What happens if a population grows past its carrying capacity?
The population keeps growing
The population starts to die off
The entire species will go extinct
The carrying capacity just increases
This may cause a population to increase
increase of food supply
removal of predators
removal of disease
all of these

A scientist was studying a population of fish in a pond over a period of 10 years. He observed that the population increased each year for 3 years, and then remained nearly constant for the rest of the study. The best explanation for this observation is that the population had
stopped reproducing
reached carrying capacity
mutated into a different species
run out of food and all died

This graph shows ....
When one population increases, the other decreases.
When one population decreases, the other increases.
When one population increases, the other increases instantly.
When one population increases, it causes the other to increases shortly after.
Which of the following are examples of a density independent factors?
forest fire
seasonal cycles
storms
disease
Which of the following are density dependent factors?
competition for resources
predation
disease
natural disasters

Which is true of this population pyramid?
There are more females than males
The population is mostly young
There are more males than females
The population is very old
Which two things increase a population size
Birth and emigration
Death and immigration
Birth and Immigration
Death and emigration
There are 50 individuals in a population and 15 more are born. 10 individuals die and 10 leave, but 20 individuals enter the area for the first time. What is the new population size?
(Birth + Immigration) - (Death + Emigration) = Pop. growth
20
15
10
-10

