Wayground logo

Free Printable Worksheets

Font size

S
M
L
XL
Worksheets

1A Two Way Tables and ScatterPlots

Total questions: 40

Worksheet time: 2hrs 0mins

Name
Class
Date
1.

Which age group liked Action movies the least? (a)  

Choose from the below words
18-25
25-49
50+
238
2.
How many people purchased no food and no drink?
3.

How many people did not attend the school play?

4.

How many people attended the basketball game but did not attend the school play?

5.

What number should go in the blue box?

6.
How many chemical engineers chose Science as their favorite subject?
7.

How many females were surveyed? (Be careful - This table is missing the totals.)

a)

45

b)

73

c)

16

d)

12

8.

How many males were surveyed? (Be careful - This table is missing the totals.)

a)

77

b)

15

c)

150

d)

52

9.
What color car is the least popular at this car dealership?
a)
Red
b)
White
c)
Blue
d)
Green
10.
How many sophomores like burritos and pizza?
a)
6
b)
5
c)
11
d)
50
11.
What type of association does this graph have?
a)
positive 
b)
negative
c)
none
d)
all of the above
12.
The scatter plot shows the relationship between the number of chapters and the total number of pages for several books.  Use the trend line to predict how many chapters would be in a book with 180 pages. 
a)
12 chapters
b)
15 chapters
c)
18 chapters
d)
21 chapters
13.
What type of correlation (association)?
The outside temperature and the amount of layers you wear. 
a)
Positive correlation
b)
Negative correlation
c)
No correlation
d)
All of the above
14.
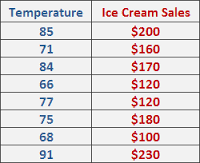
Find the equation of the line of best fit for the given data
a)
y=163.41x + 4.19
b)
y=-163.41x + 4.19
c)
y=-4.19x + 163.41
d)
y= 4.19x - 163.41
15.
The number of siblings you have and your weight. 
a)
Positive correlation
b)
Negative correlation
c)
No correlation
d)
All of the above
16.
As x increases, y increases
a)
correlation coefficient
b)
causation
c)
positive correlation
d)
negative correlation
17.
Which scatter plot shows a linear relationship between x and y?
a)
Graph A
b)
Graph B
c)
Graph C
d)
Graph D
18.
What is the correlation?
a)
Negative correlation
b)
No correlation
c)
Positive correlation
d)
All of the above
19.
As the age of the car increases, its value decreases. Which scatterplot represents this relationship?
a)
A
b)
B
c)
C
d)
D
20.
If a scatterplot has no association then...
a)
...it has no ordered pairs
b)
...it has ordered pairs that have a negative pattern
c)
...its ordered pairs have no predictable pattern
d)
...if it makes a lion on a graph (roar!)
21.
In a scatterplot, an outlier...
a)
...is something we didn't learn 8th grade
b)
...is a puppet with a long nose named Pinocchio
c)
...is a point that is far outside the main cluster of points/ordered pairs
d)
...is a really naughty point who doesn't tell the truth when outside
22.
What is a line of best fit used for?
a)
To make predictions
b)
To make the graph look pretty
c)
To connect the points
d)
To make it look like you know what you are doing
23.
What is a scatter plot?
a)
A graph that shows the relationship of two data sets.
b)
A graph drawn using rectangular bars to show how large each value is.
c)
A graph that shows information that is connected in some way.
d)
A graph that shows data changing over time.
24.
A restaurant sells pizza for the prices in the data table.  Calculate the linear regression equation of the data.
a)
y = 1.5x + 12
b)
y = 12x + 1.5
c)
y = 0.67x - 8
d)
y = -8x + 0.67
25.

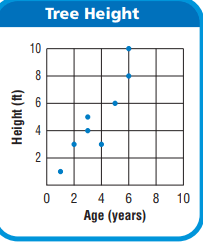
What is the age of the tree that is 8 feet tall?

a)

6 Years

b)

7 Years

c)

8 Years

d)

9 Years

26.

Given the following Scatter Plot, select the option that is most likely the r value.

a)

r=.27r=.27

b)

r=−.862r=-.862

c)

r=.934r=.934

d)

r=.54r=.54

27.

Given the following Scatter Plot, select the option that is most likely the r value.

a)

r=−.45r=-.45

b)

r=−.981r=-.981

c)

r=.728r=.728

d)

r=.12r=.12

28.

Given the following Scatter Plot, select the option that is most likely the r value.

a)

r=−.1r=-.1

b)

r=−.981r=-.981

c)

r=.92r=.92

d)

r=.765r=.765

29.

Correlation coefficient is the statistic that measures the strength and direction of a linear association between two quantitative variables.

a)

True

b)

False

30.

If r=0, there is a strong correlation.

a)

True

b)

False

31.

What is the definition of a sesquipedalianist?

a)

A biker who can ride without their hands on the handles.

b)

A person who uses long and complicated words.

c)

Someone squishy.

d)

Any animal who acts vaguely human-like.

32.
The stinging cells on a jellyfish are called?
a)
Stingers
b)
Tentacles
c)
Nematocysts
d)
Ctenophores
33.
The stinging cells on a jellyfish are called?
a)
Stingers
b)
Tentacles
c)
Nematocysts
d)
Ctenophores
34.

What country is home to kangaroos?

a)

Argentina

b)

Australia

c)

Madagascar

d)

Brazil

35.

Which planet in our solar system is known for its ring?

a)

Jupiter

b)

Mars

c)

Saturn

d)

Earth

36.
Which Continent does not touch the equator?
a)
Asia
b)
South America
c)
Antactica
d)
Africa
37.
Which file size is bigger?
a)
10 mb
b)
1000 kb
c)
1gb 
d)
1000000 b
38.

Which animal below has the longest lifespan?

a)

Human

b)

Galapagos Tortoise

c)

Gopher Tortoise

d)

Blue-Ringed Octopus

39.

He's the most famous character in video game history, and the official mascot for Nintendo.

a)

Sonic the Hedgehog

b)

Crash Bandicoot

c)

Mario

d)

Master Chief

40.
Name the 3rd President of the United States.  He was also our first Secretary of State.
a)
John Adams
b)
Abraham Lincoln
c)
Benjamin Franklin
d)
Thomas Jefferson