
 Worksheets
6A Graphs, Data and Observations Quiz
Total questions: 51
Worksheet time: 40mins
Name
Class
Date
1.
To collect or bring together into a group or set.
a)
Gather
b)
Inferences
c)
Senses
d)
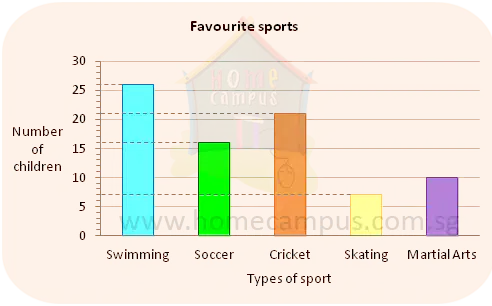
Observations
e)
Scale
2.
Using your 5 senses to gather information.
a)
Observations
b)
Inferences
c)
Senses
d)
Scale
e)
Analyze
3.
A statement or a conclusion based on your observations.
a)
Inferences
b)
Senses
c)
Observations
d)
Scale
e)
Analyze
4.
A chart that uses bars to show data.
a)
Bar Graph
b)
Inferences
c)
Senses
d)
Observations
e)
Scale
5.
relates to the number or amount of something
a)
Quantitative
b)
X-axis
c)
Y-axis
d)
Title
e)
Table
6.
The line on a graph that runs horizontally through zero.
a)
X-axis
b)
Y-axis
c)
Title
d)
Table
e)
Label
7.
What are the two types of data? (Select both options)
a)
Quantitative
b)
Qualitative
c)
X-axis
d)
Y-axis
e)
Title
8.
A chart that shows data using only words and numbers.
a)
Table
b)
X-axis
c)
Y-axis
d)
Title
e)
Label
9.
relates to the quality or characteristics of something
a)
Qualitative
b)
X-axis
c)
Y-axis
d)
Title
e)
Table
10.
Use tools such as rulers, scales and measuring cups.
a)
Quantitative
b)
Qualitative
11.
Information collected for analysis.
a)
Data
b)
X-axis
c)
Y-axis
d)
Title
e)
Table
12.
examples are color or shape
a)
Qualitative
b)
X-axis
c)
Y-axis
d)
Title
e)
Table
13.
Which word means the same as evidence?
a)
Data
b)
X-axis
c)
Y-axis
d)
Title
e)
Table
14.
examples are height or weight
a)
Quantitative
b)
X-axis
c)
Y-axis
d)
Title
e)
Table
15.

How many more students are in Period 2 than in Period 3?
a)
5
b)
4
c)
3
d)
2
e)
1
16.
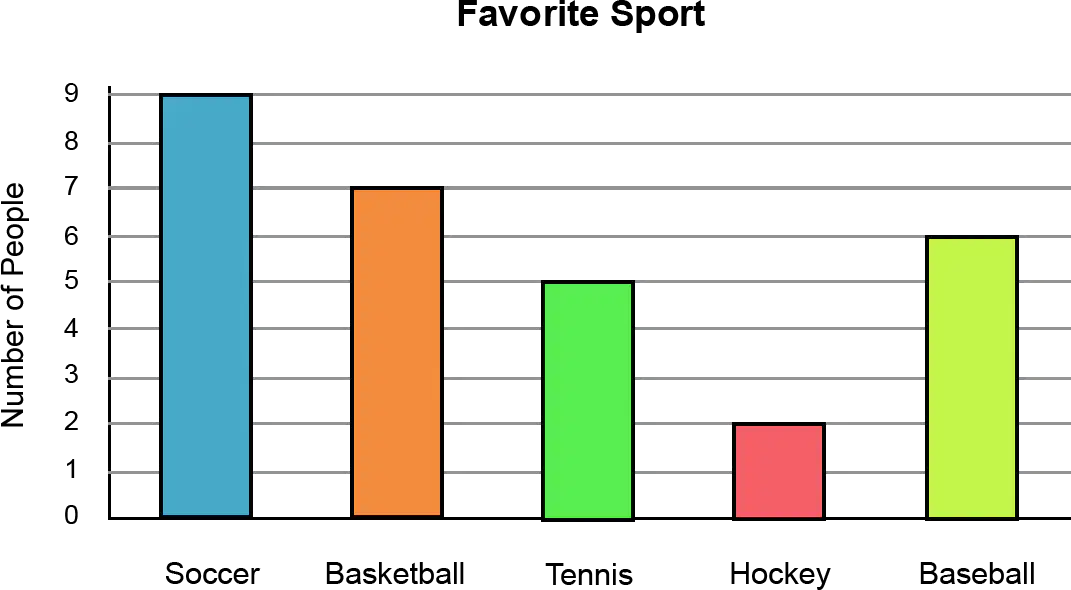
If 5 more students had picked hockey, which other sport choice would it be equal to?
a)
Basketball
b)
Baseball
c)
Tennis
d)
12
e)
Soccer
17.
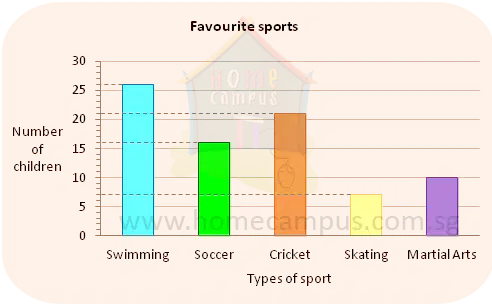
How many more students are in cricket than skating?
a)
14
b)
15
c)
26
d)
16
e)
28
18.
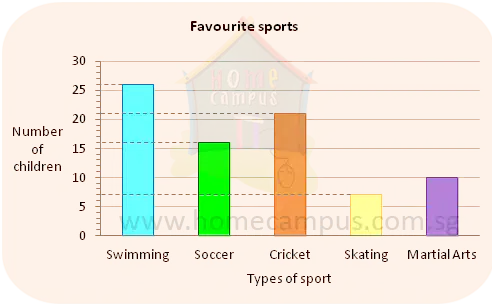
How many students are in cricket and swimming total?
a)
47
b)
4
c)
45
d)
3
e)
5
19.
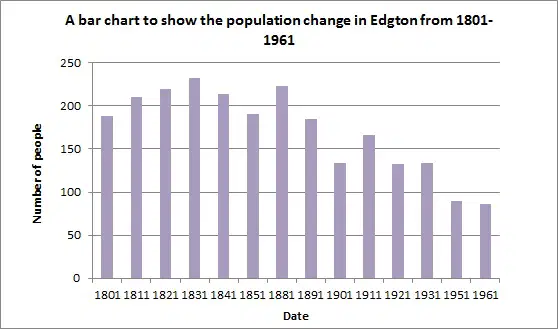
Which two years have approximately the same population?
a)
1801 and 1821
b)
1805 and 1810
c)
1901 and 1931
d)
1881 and 1921
e)
1901 and 1911
20.
Is the following statement an inference or an observation?
My shirt is orange.
a)
Observation
b)
Inference
21.
Is the following statement an inference or an observation?
The kids are sleepy.
a)
Observation
b)
Inference
22.
Is the following statement an inference or an observation?
The dogs eyes are red.
a)
Observation
b)
Inference
23.
Is the following statement an inference or an observation?
There are 15 students in this 6th grade classroom.
a)
Observation
b)
Inference
24.
Is the following statement an inference or an observation?
The blue shirt is on top of the table.
a)
Observation
b)
Inference
25.
Is the following statement an inference or an observation?
The 6th grade class is a good class.
a)
Observation
b)
Inference
26.
Is the following statement an inference or an observation?
The chromebook weighs 3 pounds.
a)
Observation
b)
Inference
27.
Is the following statement quantitative or qualitative?
The chromebook weighs 3 pounds.
a)
Qualitative
b)
Quantitative
28.
Is the following statement quantitative or qualitative?
The student is five feet tall.
a)
Qualitative
b)
Quantitative
29.
When calculating the median, what do you do if there are 2 numbers in the middle?
a)
Keep them both.
b)
Add them and then divide by 2.
c)
Subtract them.
30.
Is the following statement quantitative or qualitative?
The cup has four ounces of water in it.
a)
Qualitative
b)
Quantitative
31.
Is the following statement quantitative or qualitative?
There are 15 desks in the room.
a)
Qualitative
b)
Quantitative
32.
Is the following statement quantitative or qualitative?
The computer keys feel soft.
a)
Qualitative
b)
Quantitative
33.
Is the following statement quantitative or qualitative?
The plants leaves are rough.
a)
Qualitative
b)
Quantitative
34.
Is the following statement quantitative or qualitative?
33 people ordered the book from the visiting author.
a)
Qualitative
b)
Quantitative
35.
Is the following statement quantitative or qualitative?
The students fingers smelled like lemon after they rubbed their fingers on the lemon balm leaves.
a)
Qualitative
b)
Quantitative
36.
Is the following statement quantitative or qualitative?
The soil of the pitcher plant is soggy and green.
a)
Qualitative
b)
Quantitative
37.
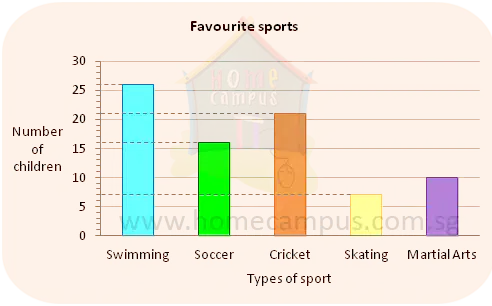
Name one of the categories.
a)
Favourite sports
b)
Number of children
c)
Types of sports
d)
Skating
e)
number of sports
38.
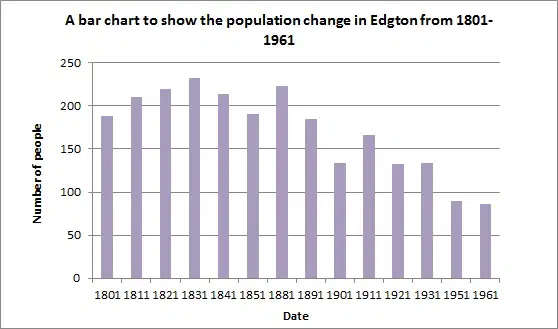
What is the label for the x-axis?
a)
Number of people
b)
Date
c)
1961
d)
there is no label
39.
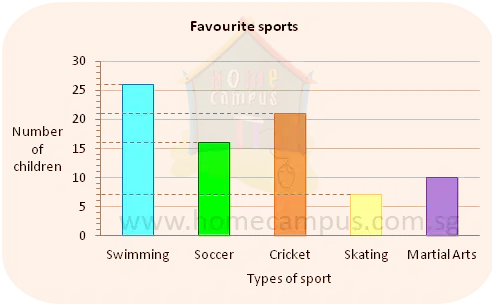
What is the title of this graph?
a)
Favourite sports
b)
Number of children
c)
Types of sports
d)
Skating
e)
number of sports
40.
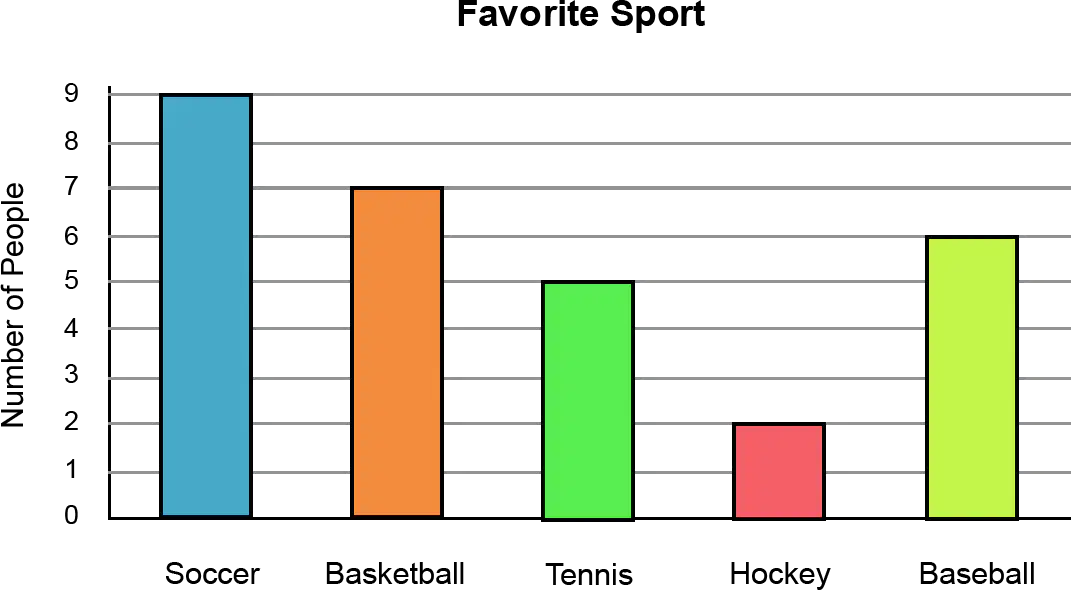
How many people total were surveyed, assuming each person was only allowed one vote?
a)
29
b)
28
c)
26
d)
12
e)
30
41.
What is the label on the y-axis?
a)
Favourite sports
b)
Number of children
c)
Types of sports
d)
Skating
e)
number of sports
42.
What is the mean of the data set below?
3,5,8,1,4,7
a)
4.66
b)
5.6
c)
22.166
d)
4
43.
What is the mode of the data set below?
3,5,8,1,4,7,5,5
a)
5
b)
6
c)
22.166
d)
7
44.
What is the first step to calculating the median?
3,5,8,1,4,7
a)
Put the numbers in order from least to greatest
b)
Add all the numbers up
c)
Look for the number in the middle
45.
Which option is best described by the word "most"?
a)
mean
b)
median
c)
mode
d)
range
46.
Which option is best described by the word "average"?
a)
mean
b)
median
c)
mode
d)
range
47.
Which option is calculated by subtracting the smallest number from the largest number?
a)
mean
b)
median
c)
mode
d)
range
48.
Calculate the range of this data set?
4,7,10,8,3,3,12
a)
9
b)
4
c)
7
d)
3
e)
6.71
49.
What is the mode of this data set?
4,7,10,8,3,3,12
a)
3
b)
4
c)
7
d)
9
e)
6.71
50.
Calculate the mean of this data set?
4,7,10,8,3,3,12
a)
6.71
b)
4
c)
7
d)
3
e)
9
51.
Besides using your 5 senses, how else can you collect, or gather observations? (take your time on this one)
a)
Using graphs
b)
Using tools
c)
Using your sight
d)
There is no other way
e)
Using your 5 fingers
100 %

