wayground logo

Free Printable Worksheets

NEW

Font size

S
M
L
XL
Worksheets

Introduction to Economics (2)

Total questions: 25

Worksheet time: 27mins

Name
Class
Date
1.

In my country my job is the same one that my family has done over the past 200 years.

a)

Traditional

b)

Command

c)

Market

d)

Mixed

2.

In my country, central planners decide when we should expand old factories and build new ones.

a)

Traditional

b)

Command

c)

Market

d)

Mixed

3.
In a command economy, who holds power over the economy?
a)
The people
b)
The government 
c)
Beyonce
d)
The traditions of your ancesetors 
4.
If I produce meat but, the government has to check to make sure I can put this product on the market, what economic system is this?
a)
Mixed
b)
Traditional
c)
Market 
d)
Command
5.
Which economy is dictated by supply and demand and the buyers and sellers?
a)
Market
b)
Socilaism 
c)
Mixed 
d)
Command 
6.
Which of the following is an economic system in which the government and individuals are used to decide how to use scarce resources?
a)
Market economy
b)
Command economy
c)
Traditional economy
d)
Mixed economy
7.

The Country of North Korea has a dictator that makes all of the economic decisions. What type of economy is this?

a)

Traditional

b)

Market

c)

Command

d)

Mixed

8.

Which of the following best explains a mixed economy?

a)

Private ownership of the factors of production and regulation of businesses by government

b)

Market exchanges answer all three of the big economic questions

c)

Family customs and traditions determine what and how to produce a good

d)

Government answers all three of the big economic questions

9.

A _________ economy is a market-based system in which the government is involved to some extent.

a)

Traditional

b)

Planned/command

c)

Mixed

d)

Free Market

10.
Who or what answers the basic economic questions in a mixed economy?
a)
Individuals and Businesses
b)
Government
c)
Custom
d)
Individuals, Businesses, and Government
11.

The table shows the production possibilities for a country. Based on the table, which of the following production combinations is a possibility?

a)

28 pizzas and 5 pairs of shoes

b)

3 pairs of shoes and 23 pizzas

c)

2 pairs of shoes and 20 pizzas

d)

4 pairs of shoes and 15 pizzas

12.
What is opportunity cost?
a)
a graph that shows how much an economy can produce between 2 goods
b)
how much money something is
c)
the opportunity one has to give up in order to gain something else
d)
land, labor, capital, entrepreneurs
13.
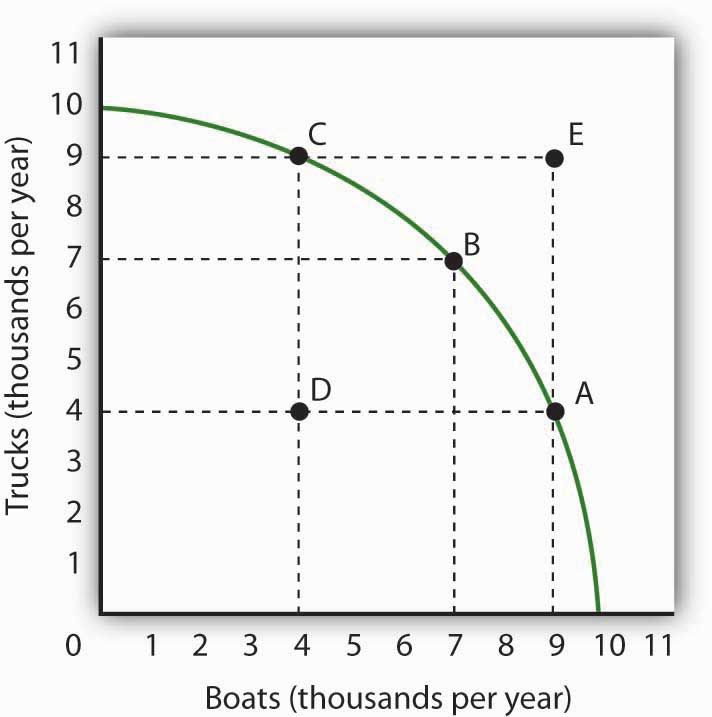
The opportunity cost of increasing production from 7 to 9 trucks is
a)
Scarcity
b)
2 boats
c)
2 trucks
d)
3 boats
14.
The opportunity cost of increasing production from 4 to 7 boats is
a)
1 boat
b)
2 boats
c)
2 trucks
d)
3 trucks
15.
Movement down the PPF curve indicates that the opportunity cost of more capital goods is producing more consumer goods
a)
True
b)
False
16.
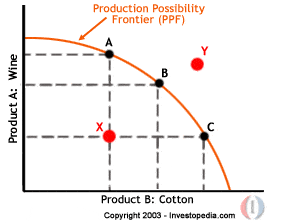
What does point Y represent on the PPC?
a)
Efficiency
b)
Unattainable / impossible
c)
Inefficency
d)
Nothing
17.
What does point B represent?
a)
Production at greater than the country's minimum potential
b)
Production is less than the country's minimum potential
c)
Productive inefficiency
d)
Productive efficiency
18.
Which point represents "resources are not being used efficiently, or resources are being wasted or idle"?
a)
Point A
b)
Point Y
c)
Point X
d)
All of the above
19.
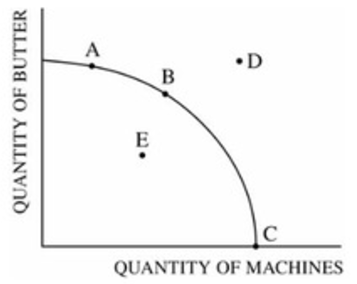
The diagram shows the production possibilities curve for Country Y. Which of the following statements is true?
a)
If Country Y is producing at point C, it is using all its resources efficiently
b)
The opportunity cost of producing more machines is constant
c)
Country Y cannot produce at point E
d)
The most efficient point of production is point D
20.
The diagram shows the production possibilities curve for Country Y. Which of the following statements is true?
a)
If Country Y is producing at point C, it is using all its resources efficiently
b)
The opportunity cost of producing more machines is constant
c)
Country Y cannot produce at point E
d)
The most efficient point of production is point D
21.

What does the Production Possibilities Curve (PPC) illustrate?

a)

The maximum output that an economy can produce without increasing the quantities of inputs

b)

The relationship between the prices of different goods

c)

The amount of labor needed to produce a certain amount of goods

d)

The profit maximization strategies of firms

22.

Would meeting point E be possible in this scenario?

a)

Yes, the resources can grow over time

b)

No, because the point lies outside what the resources can produce at the time.

c)

Yes, point E represents an optimal state for the producer

d)

Maybe, the possibilities are infinite in this scenario

23.

What does the PPC assume about the state of technology?

a)

It is constantly improving

b)

It remains constant when drawing a specific curve

c)

It is irrelevant to the curve

d)

It decreases over time

24.

What does a movement from a point inside the PPC to a point on the PPC represent?

a)

A decrease in economic efficiency

b)

An increase in economic efficiency

c)

A shift in consumer preferences

d)

A change in the price of raw materials

25.
What does point B represent?
a)
Production at greater than the country's minimum potential
b)
Production is less than the country's minimum potential
c)
Productive inefficiency
d)
Productive efficiency