
 Worksheets
24-02-25: Production Possibility Curve
Total questions: 38
Worksheet time: 19mins
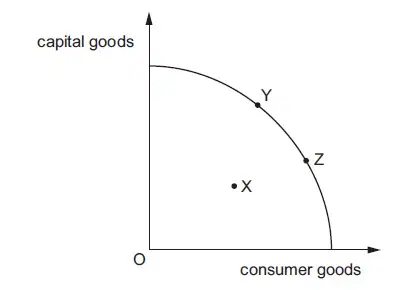
The Production Possibility Curve shows:
the maximum possible output combinations of two goods or services an economy can achieve when all resources are fully and efficiently utilized.
the minimum output levels required to sustain an economy.
the average production levels of an economy over a period of time.
the potential growth rate of an economy.
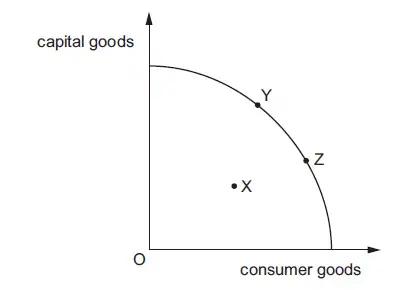
Which of the following points on the Production Possibility Curve represents the maximum output of consumer goods?
A
B
C
D
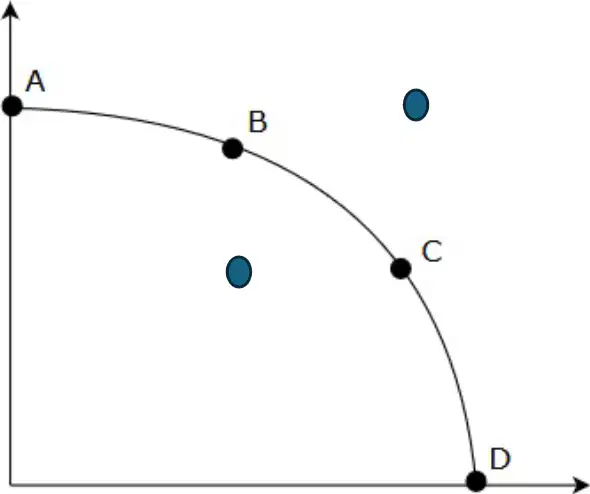
What does any point inside the curve represent in terms of resource use?
Efficient use of resources
Inefficient use of resources
Optimal use of resources
Excessive use of resources

Which of the following statements is true about a point on the curve?
A) It represents inefficient use of resources.
B) It represents maximum use of resources.
C) It represents no use of resources.
D) It represents partial use of resources.
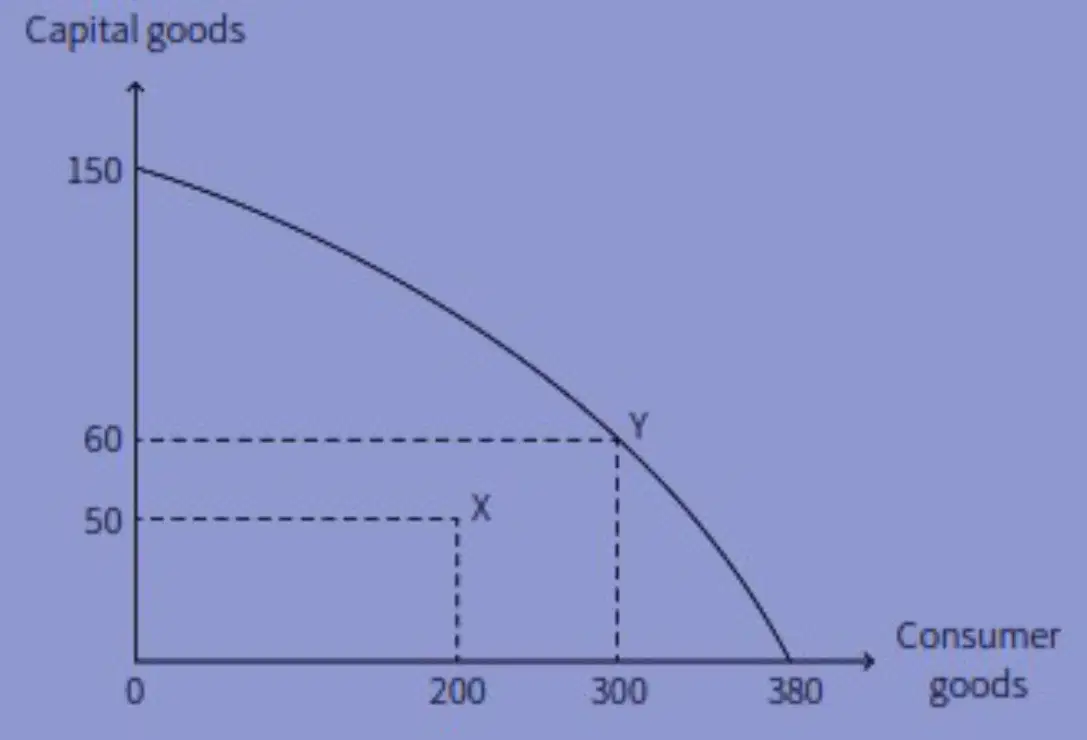
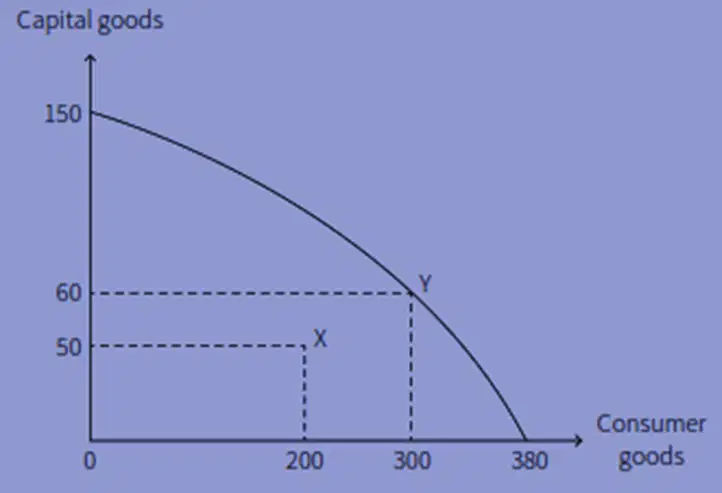
If a country is producing at point X, what is its output of capital goods and consumer goods?
The output is 100 units of capital goods and 200 units of consumer goods.
The output is 150 units of capital goods and 150 units of consumer goods.
The output is 200 units of capital goods and 100 units of consumer goods.
None of these
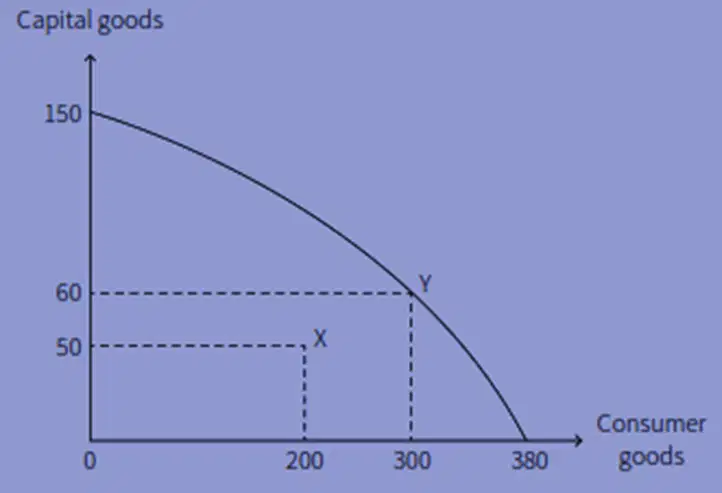
If a country’s output moves from point X to point Y, how many more capital goods and how many more consumer goods will it produce?
10 more capital goods and 100 more consumer goods
15 more capital goods and 25 more consumer goods
20 more capital goods and 30 more consumer goods
25 more capital goods and 35 more consumer goods
What is the maximum number of capital goods that can be produced if all resources are devoted to capital goods?
100 units
200 units
150 units
400 units

What does the graph of the Production Possibility Curve (PPC) illustrate?
The trade-off between manufactured goods and agricultural goods
The increase in production of manufactured goods only
The decrease in production of agricultural goods only
The equilibrium point of supply and demand
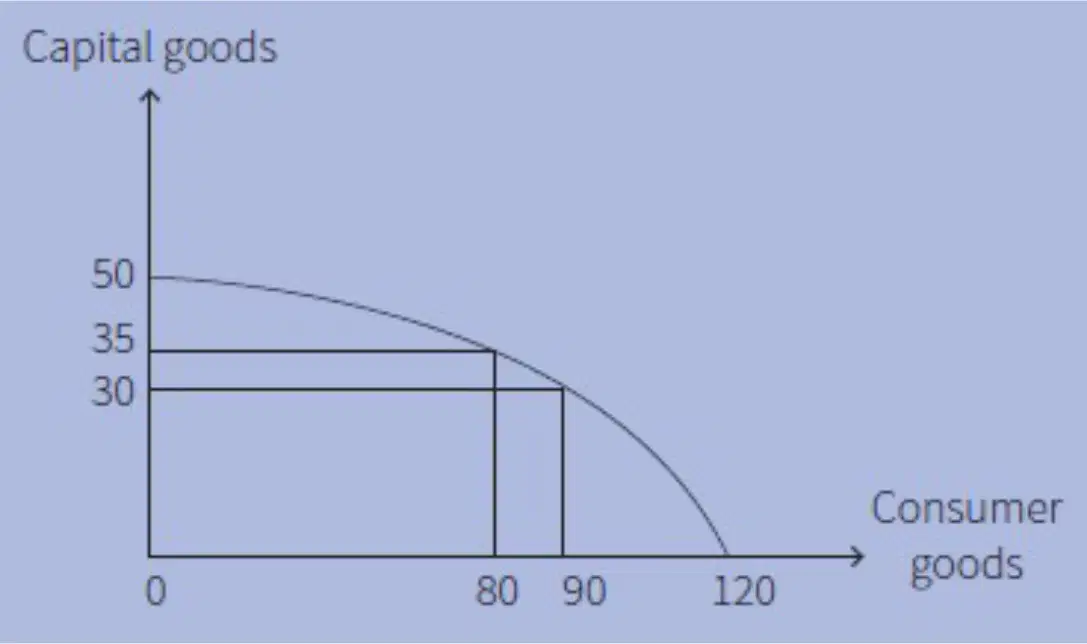
State the maximum number of capital goods the country can produce if it devotes all of its resources to making capital goods.
10 units
20 units
50 units
120 units
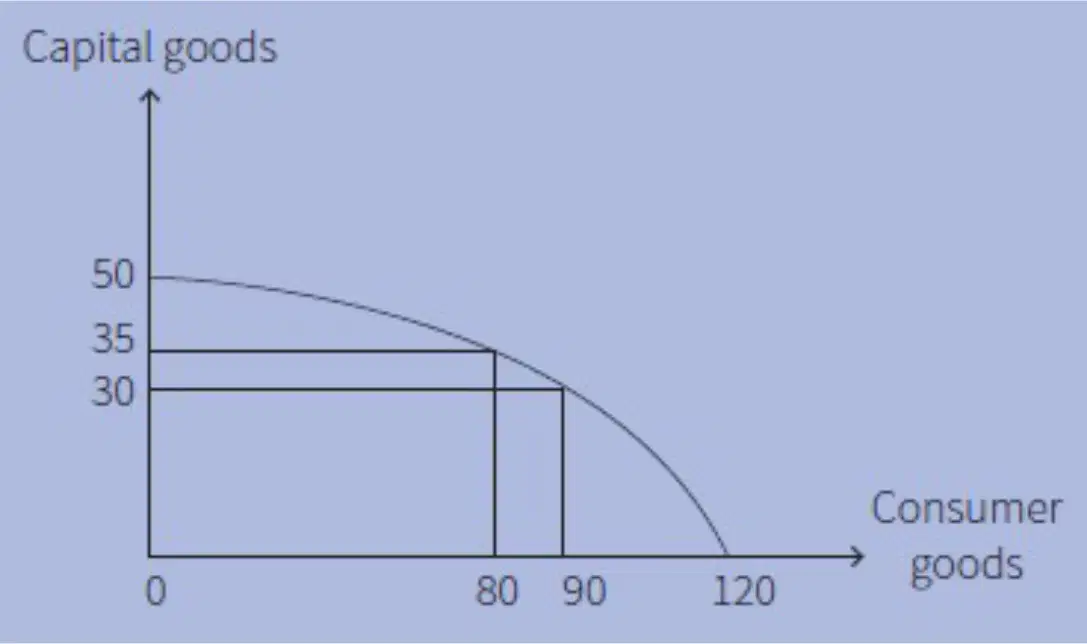
Calculate the opportunity cost of increasing the output of consumer goods from 80 to 90 units.
10 units of capital goods
5 units of capital goods
15 units of capital goods
20 units of capital goods
What is the usual shape of the Production Possibility Curve (PPC) and why?
Bowed inwards, because resources are not efficiently used.
Bowed outwards, because the best resources are used first to produce a particular type of product.
Straight line, because resources are perfectly substituted.
Circular, because resources are equally distributed.
Fill in the blank: When the resources can be perfectly substituted between the production of two goods without any loss in efficiency, the PPC is a _________.
Straight line
Curved line
Vertical line
Horizontal line
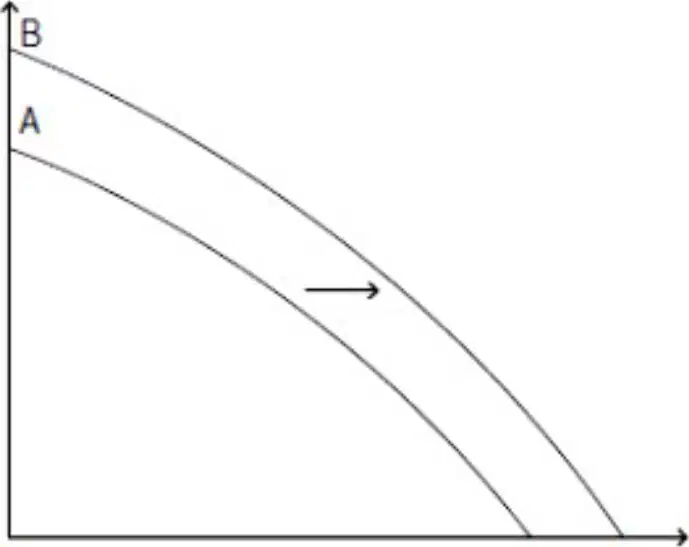
What causes the PPC to shift to the right?
Increase in resources
Decrease in resources
Technological regression
Higher unemployment
What causes the PPC to shift to the left?
Decrease in resources
Increase in resources
Technological advancement
Improvement in labor skills
Advances in technology will cause a shift of a country’s PPC to the:
Left
Right
No shift
Cannot be determined
A rise in the retirement age will cause a shift of a country’s PPC to the:
Left
Right
No shift
Cannot be determined
Improved education will cause a shift of a country’s PPC to the:
Left
Right
No shift
Cannot be determined
Widespread floods will cause a shift of a country’s PPC to the:
Left
Right
No shift
Cannot be determined
Worn out capital goods not being replaced will cause a shift of a country’s PPC to the:
Left
Right
Depict the changes for the following: New robot making technology.
The PPC shifts outward due to technological advancement.
The PPC shifts inward due to resource depletion.
The PPC remains unchanged as technology has no effect.
The PPC becomes a straight line due to constant opportunity cost.
Depict the changes for the following: Decrease in the demand for pizza.
A decrease in demand for pizza shifts the PPC inward.
A decrease in demand for pizza shifts the PPC outward.
A decrease in demand for pizza does not affect the PPC.
A decrease in demand for pizza makes the PPC steeper.
Depict the changes for the following: Mad cow disease kills 85% of cows.
The PPC will shift inward due to a decrease in resources.
The PPC will shift outward due to an increase in resources.
The PPC will remain unchanged.
The PPC will become a straight line.
Depict the changes for the following: Destruction of power plants leads to severe electricity shortage.
The PPC will shift inward due to reduced production capacity.
The PPC will shift outward due to increased production capacity.
The PPC will remain unchanged as production capacity is unaffected.
The PPC will become a straight line due to constant opportunity cost.
Depict the changes for the following: Faster computer hardware.
A PPC shows an outward shift due to technological advancements.
A PPC shows an inward shift due to resource depletion.
A PPC remains unchanged as technology does not affect it.
A PPC shows a shift to the left due to increased costs.
Depict the changes for the following: Many workers unemployed.
The PPC will shift inward due to decreased labor force.
The PPC will shift outward due to increased efficiency.
The PPC will remain unchanged as unemployment doesn't affect it.
The PPC will become a straight line due to constant opportunity cost.
Depict the changes for the following: Significant increases in education.
A PPC shifts outward due to increased education, indicating economic growth.
A PPC shifts inward due to increased education, indicating economic decline.
A PPC remains unchanged with increased education, indicating no economic impact.
A PPC shifts outward due to increased education, indicating economic decline.
How does new robot making technology affect the production possibilities curve?
It shifts the curve outward, indicating increased production capacity.
It shifts the curve inward, indicating decreased production capacity.
It has no effect on the production possibilities curve.
It makes the curve steeper, indicating a change in opportunity cost.
What happens to the curve when there is a decrease in the demand for pizza?
The curve shifts to the left because demand decreases.
The curve shifts to the right because demand increases.
The curve remains unchanged because the decrease in demand is reflected in a movement along the curve, not a shift.
The curve becomes vertical because demand is perfectly inelastic.
Explain how a reduction in electricity affects the production possibilities for both capital goods and consumer goods.
A reduction in electricity decreases the production possibilities for both capital goods and consumer goods.
A reduction in electricity increases the production possibilities for both capital goods and consumer goods.
A reduction in electricity has no effect on the production possibilities for both capital goods and consumer goods.
A reduction in electricity only affects the production possibilities for consumer goods.
Explain how faster computer hardware affects the production possibilities curve, as shown in the diagram. Quality of a resource improves shifting the curve outward.
Faster computer hardware shifts the production possibilities curve outward.
Faster computer hardware shifts the production possibilities curve inward.
Faster computer hardware has no effect on the production possibilities curve.
Faster computer hardware shifts the production possibilities curve to the left.
Many workers unemployed. Explain why the curve doesn't shift when there is unemployment, and why unemployment is just a point inside the curve.
The curve doesn't shift because unemployment represents underutilization of resources, not a change in resource availability.
The curve shifts because unemployment indicates a change in resource availability.
Unemployment causes the curve to shift inward due to decreased productivity.
The curve shifts outward as unemployment decreases.
Explain how significant increases in education can lead to an outward shift in the production possibility curve, as shown in the diagram. The quality of labor is improved. Curve shifts outward.
Increases in education improve labor quality, leading to more efficient production and an outward shift in the curve.
Education has no effect on the production possibility curve.
Increased education leads to a decrease in labor quality, shifting the curve inward.
Education only affects the production of goods, not the production possibility curve.
What does a PPC illustrate?
Opportunity cost
Demand and supply
Market equilibrium
Consumer preferences
What does a movement along a PPC show?
Increase in resources
Reallocation of resources and opportunity cost
Decrease in technology
Consumer demand
A bowed outwards PPC shows a/an ________ opportunity cost.
decreasing
parallel
none of these
An increase in the quantity or quality of resources will cause a shift of the PPC to the ________.
right
left
upward
downward
A country experiences a fall in unemployment. How would this be shown on a PPC diagram?
A movement of the production point away from the curve
A movement of the production point towards the curve
A shift of the PPC to the left
A shift of the PPC to the right

Which points in the diagram can be unattainable if there's no new economic resources?
A) R and S
B) V and W
C) R, S, T and U
D) T, U, V and W

