
Font size
 Worksheets
Key Features of Linear, Quadratic, Exponential Functions
Total questions: 45
Worksheet time: 1hrs 8mins

The graph of a linear function is shown on the grid. What value best represents the y-intercept of the line?
-2
-3/2
2/3
3

The graph of a linear function, f, is shown. What is the zero of f?
3
3
2
6
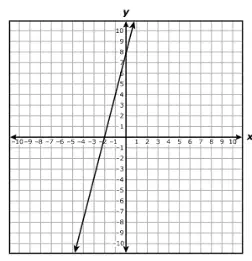
The graph of a linear function is shown on the grid. What are the x-intercept and the y-intercept of the line?
x-intercept: (8, 0), y-intercept: (0, -2)
x-intercept: (-2, 0), y-intercept: (0, 4)
x-intercept: (-2, 0), y-intercept: (0, 8)
x-intercept: (4, 0), y-intercept: (0, 8)
Which graph best represents y = -4(x + 3) - 2?

F

G

H

J
Linear function k has a zero of -2 and a y-intercept of 6. Which graph best represents k?

F

G

H

J
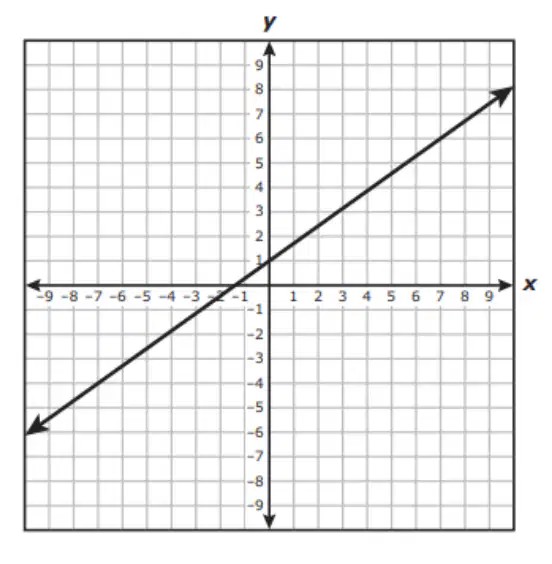
The graph of linear function g passes through the points (-7, -4) and (7, 6). What are the slope and y-intercept of the graph of g?
The slope is 75 , and the y-intercept is -1.
The slope is 75 , and the y-intercept is 1.
The slope is 57 , and the y-intercept is -1.
The slope is 57 , and the y-intercept is 1.
Linear function t has an x-intercept of -1 and a y-intercept of 5. Which graph best represents t?

A

B

C

D
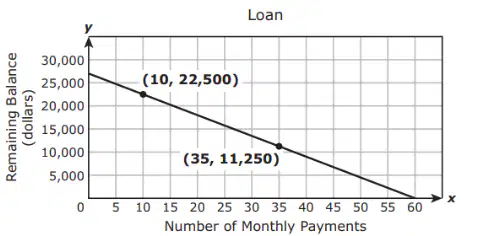
The graph models the linear relationship between the number of monthly payments made on a loan and the remaining balance in dollars left to pay on the loan. Which statement describes the x-intercept of the graph?
The x-intercept is 60, which represents the initial balance in dollars of the loan.
The x-intercept is 27,000, which represents the initial balance in dollars of the loan.
The x-intercept is 60, which represents the number of monthly payments needed to repay the loan.
The x-intercept is 27,000, which represents the number of monthly payments needed to repay the loan.
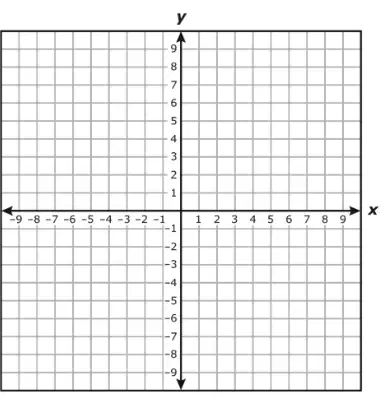
The graph of linear function k passes through the points (-7, 0) and (1, 8). Which statement must be true?
The slope of the graph of k is 4/3.
The graph of k passes through the point (-1, -8).
The zero of k is 7.
The x-intercept of the graph of k is -7.
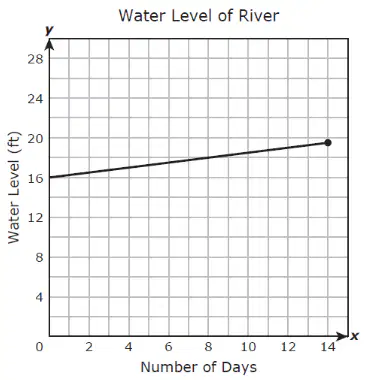
The water level of a river was measured each day during a two-week period. The graph models the linear relationship between the water level of the river in feet and the number of days the water level was measured. Which statement best describes the y-intercept of the graph?
The water level increased by 0.25 ft per day.
The maximum water level was 19.5 ft.
The initial water level was 16 ft.
The water level was measured for 14 days.
A paper airplane was thrown from the top of a tall building. The height of the paper airplane above the ground can be found using the function y=-1.5x+60 , where x is the time in seconds the airplane has been in the air. How many seconds did it take the paper airplane to reach the ground?
(a)
Which line appears to have an x-intercept of -5 and a y-intercept of 3?

F

H

J

A lifeguard earns $320 per week for working 40 hours plus $12 per hour worked over 40 hours. A lifeguard can work a maximum of 60 hours per week. Which graph best represents the lifeguard's weekly earnings in dollars for working h hours over 40?

F

G

H

J

The graph of a function is shown on the grid. Which ordered pair best represents the location of the y-intercept?
(1/3, 0)
(0, -2)
(0, 1/3)
(-2, 0)
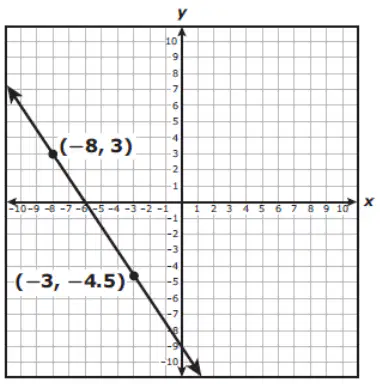
The graph of linear function g is shown on the grid. What is the zero of g?
-6
-9
-3
8
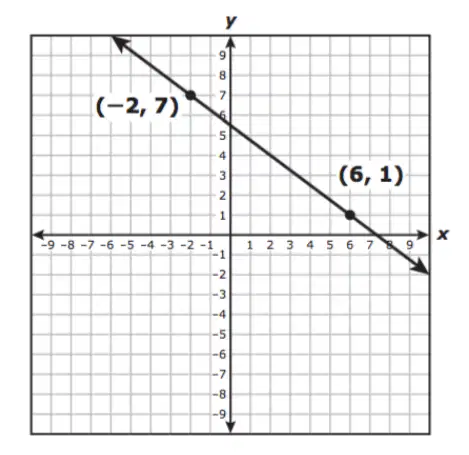
What is the y-intercept of the line graphed on the grid?
7
5.5
6
22/3
Which graph shows a line with an x-intercept of -5?

A

B

C

D
Which graph best represents a quadratic function that has no real zeros?


B

C

D
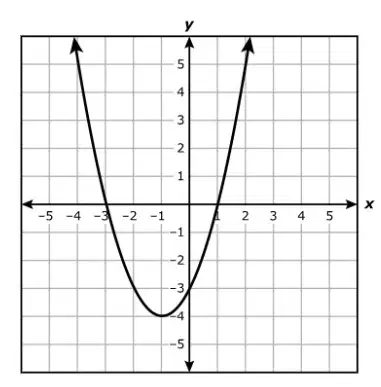
A graph of a quadratic function is shown on the grid.
The function has a (a) value of (b) .
1
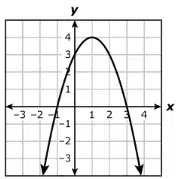
The graph of a quadratic function is shown on the grid. Which statement appears to be true?
The function has 3 zeros.
The maximum value of the function is 3.
The vertex of the graph of the function is (4, 1).
The equation of the axis of symmetry of the graph of the function is x = 1.

The graph of a quadratic function is shown. Which values best represent the zeros of the function?
x=1
x=-4
x=-1
x=3
x=-3

The graph of a quadratic function r is shown on the grid. Which answer choice best represents the intercepts of the graph of r?
x-intercept: (5,0)
y-intercepts: (0,10) and (0,-2)
x-intercept: (0,-10) and (0,2)
y-intercepts: (-5,0)
x-intercept: (0,5)
y-intercepts: (10,0) and (-2,0)
x-intercepts: (-10,0) and (2,0)
y-intercepts: (0,-5)
Which graph best represents h(x)=(x+1)(x−3) ?


Two characteristics of quadratic function p are given.
- The axis of symmetry of the graph of p is x=-3.
- Function p has exactly one zero.
Based on this information, which graph could represent p?


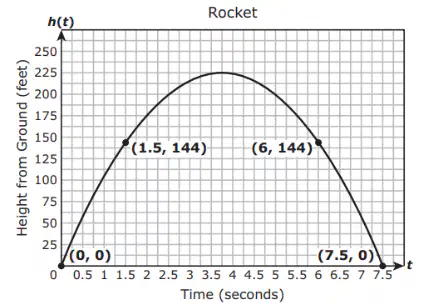
Quadratic function h can be used to model the height in feet of a rocket from the ground t seconds after it was launched. The graph of the function is shown.
What is the maximum value of the graph of the function?
(a)
Which graph best represents y=−x2+6x−1 ?


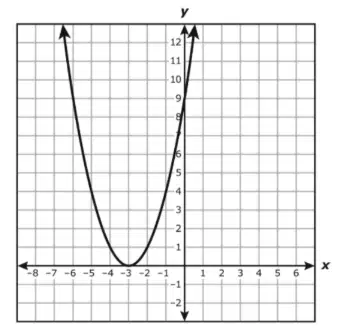
The graph of quadratic function k is shown on the grid. Which statements are best supported by the graph of k?
I. The x-intercept is located at (-3,0)
II. The coordinates of the y-intercept are (0,9)
III. The axis of symmetry is x=-3
I and II only
I and III only
II and III only
I, II, and III
Which graph best represents a quadratic function that has only one zero?


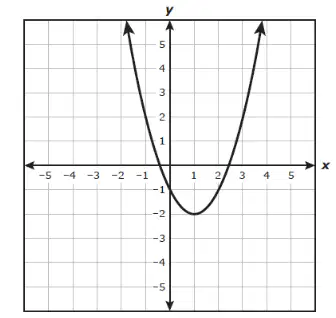
A graph of a quadratic function is shown on the grid.
Which coordinates best represent the vertex of the graph?
(2.4,0)
(0,-1)
(-0,4,0)
(1,-2)
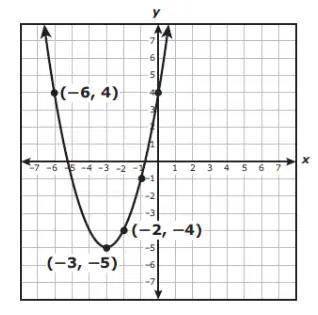
The graph of quadratic function f is shown on the grid. What is the y-intercept of the graph of f?
(a)

The graph of a quadratic function is shown on the grid. Which equation best represents the axis of symmetry?
y=6
x=2
y=4
x=0
Which statement about the graph of y=16(0.5)x is NOT true?
The y-intercept is (0,16).
The graph is decreasing for all values of x.
The x-intercept is (0.5,0).
The graph has a horizontal asymptote at y=0.
The exponential function has these characteristics:
-The y-intercept is 2.
-The function is increasing at a rate of 50%.
Which graph best represent this function?


What is the euqation of the asymptote of the graph of the function y=16(0.75)x ?
(a) = (b)
A customer purchases an electronic device for $650. Each year the value of the electronic device decreases by 30%.
Which statement is true about the graph that represents the relationship between the value of the device in dollars, y, and the number of years, x, since the device was purchased?
The y-intercept of the graph is 650.
The y-intercept of the graph is 455.
The graph has a vertical asymptote at x=0
The graph has a horizontal asymptote at y=30
What is the value of the y-intercept of the graph of h(x)=12.3(4.9)x
(a)
The initial value of a home is $200,000. The value of the home will increase at a rate of 6% each year.
Which graph best models this situation?


What is the value of the y-intercept of the graph of g(x)=73(54)x ?
(a)
Which graph best represents y=5(31)x ?


What is the value of the y-intercept of the graph of h(x)=29(5.2)x
(a)
Which graph best represents y=10(0.85)x ?


Which statement about the graph of y=8(0.25)x is true?
The coordinates of the x-intercept are (0.25,0)
The coordinates of the y-intercept are (0,8)
The equation of the asymptote is x=0
The graph includes the point (2,1)
Which graph best represents f(x)=2(5)x ?


The graph of an exponential function is shown on the grid.
Which dashed line is an asymptote for the graph?
Line q
Line r
Line s
Line t
Which statement about the graph of y=31(32)x is true?
The graph has a vertical asymptote.
The graph crosses the y-axis at (0,92) .
The graph has an asysmptote at y=31 .
The graph decreases from left to right.

