
 Worksheets
PSTQUIZ225
Total questions: 20
Worksheet time: 12mins
Which of the following best defines a supply chain?
A group of retail stores
A company’s internal management
A system of organizations involved in moving a product from supplier to customer
A warehouse connected to a factory
Which function manages the relationship between supply and demand in the supply chain?
Procurement
Finance
Demand planning
Invoicing
What does the ‘bullwhip effect’ refer to in a supply chain?
Stable product demand
Centralized warehousing
Increasing order variability up the supply chain
Faster product delivery
How can good supply chain management contribute to a company's competitiveness?
By reducing product innovation
By lowering delivery speed
By improving cost efficiency and customer satisfaction
By outsourcing marketing functions
Which of the following strategies can help reduce the bullwhip effect?
Increasing order quantities
Reducing visibility between supply chain partners
Sharing real-time demand data
Using only one supplier
"Making it right the first time" is:
A user-based definition of quality.
A manufacturing-based definition of quality.
A product-based definition of quality.
The definition of quality proposed by the American Society for Quality
All of the following costs are likely to decrease as a result of better quality EXCEPT:
customer dissatisfaction costs.
inspection costs.
scrap costs.
warranty and service costs.
A Three Sigma program has how many defects per million?
34
3 - 4
3 times the standard deviation
2700
The process improvement technique that sorts the vital few from the trivial many is:
Taguchi analysis.
Pareto analysis.
benchmarking.
Deming analysis.
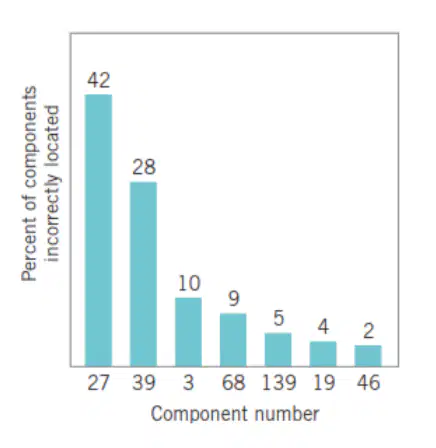
Consider the Pareto chart in the next picture. The vertical axis is the percentage of components incorrectly located, and the horizontal axis is the component number, a code that locates the device on the printed circuit board. Locations number 27 and 39 account for how many percent of errors?
70%
80%
66%
89%
Quality control charts usually have a central line and upper and lower control limit lines. Which of the following is not a reason that the process being monitored with the chart should be investigated?
A large number of plots are close to the upper or lower control lines
The behaviour of the plots is erratic
A single plot falls above or below the control limits
There is a change in raw material or operators
If there are 400 total defects from 8 samples, each sample consisting of 20 individual items in a production process, which of the following is the fraction defective that can be used in a p-chart for quality control purposes?
400
160
2.5
1.0
For which of the following should we use a p-chart to monitor process quality?
The dimension of brick entering a kiln
Lengths of board cut in a mill
The weigh of fluid in a container
Grades in a freshman “pass/fail” course
For which of the following should we use an R-chart to monitor process quality?
Grades in a freshman “pass/fail” course
Tire pressures in an auto assembly plant
Vehicles passing emission inspection
Computer software errors
You are developing an X-bar chart based on sample means. You know the standard deviation of the sample means is 4, the desired confidence level is 99.7 percent (Z=3), and the average of the sample means is 24. Which of the following is your UCL?
36
24
12
4
Quality can improve profitability by reducing costs. Which of the following is NOT an aspect of reduced costs by quality improvements?
flexible pricing
increased productivity
lower rework and scrap costs
lower warranty costs

In this pair wise comparison matrix, what value is X?
0.2
0.5
4
0.25

Based on this pairwise comparison matrix, which statement(s) best define the meaning of number in the circle?
Comfort is 4 times more important than color
Color is 4 times more important than comfort
Color is 0.25% less important than comfort
No right answer
Which of the following is a key step in AHP?
Clustering decision makers
Calculating net present value
Structuring the decision problem into a hierarchy
Drafting financial statements
What is the maximum acceptable value for the consistency ratio (CR) in AHP?
0.01
0.05
0.10
1.00

