
 Worksheets
2024 - Test #2 Rev. 8/29/24
Total questions: 37
Worksheet time: 19mins
Name
Class
Date
1.
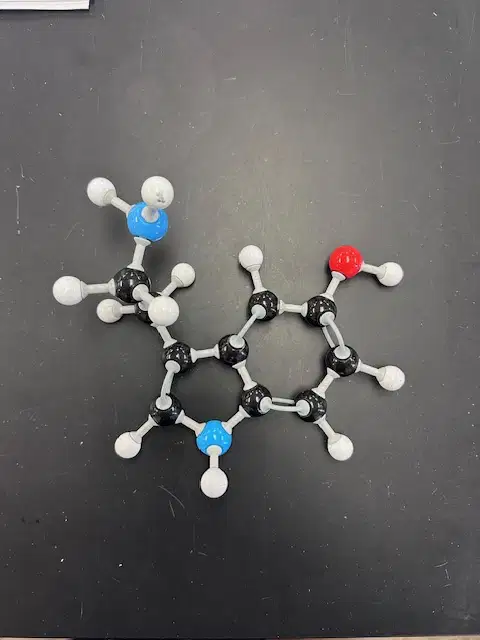
True or False: The name of the molecule below is Dopamine.
a)
True
b)
False
2.
The model pieces above were used in class and represent......
a)
Hydrogen Bonds
b)
Single Covalent Bonds
c)
Double Covalent Bonds
d)
Ionic Bonds
e)
None of the above
3.
Everything in on Earth can be categorized into 2 categories, _____________ or ______________.
a)
Energy
b)
Matter
c)
Molecules
d)
Atoms
e)
Living Things
4.
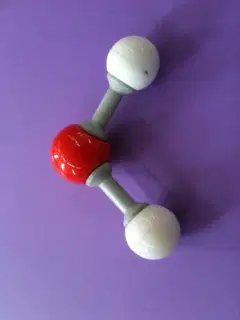
How many molecules are displayed below?
a)
1
b)
2
c)
3
d)
0
5.
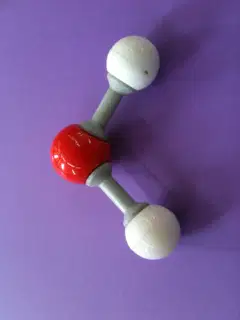
How many double bonds in the molecule below?
a)
1
b)
2
c)
3
d)
0
6.
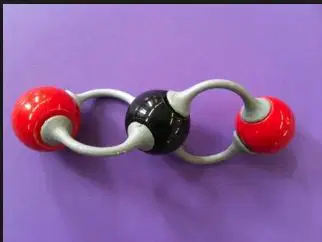
How many Carbon atoms make up the following molecule?
a)
1
b)
2
c)
3
d)
4
e)
5
7.
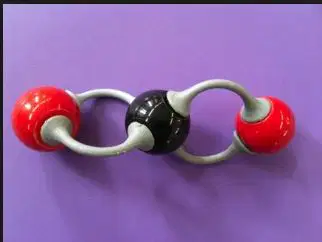
How many double bonds in this molecule?
a)
1
b)
2
c)
3
d)
4
e)
5
8.
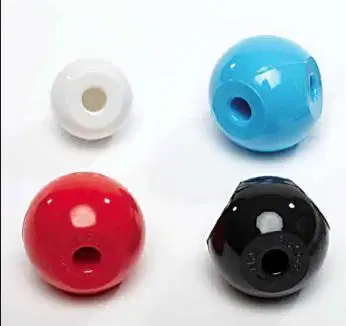
These marbles represent.......
a)
Molecules
b)
Cells
c)
Atoms
d)
Living Matter
e)
All of the above
9.
Which of the following character traits will help you earn the trust of your teachers?
a)
Integrity
b)
Courage
c)
Self-Discipline
10.
Which of the following character traits will you need to face your fears of participating in class?
a)
Integrity
b)
Courage
c)
Self-Discipline
11.
Which of the following character traits will you need to make sure you take notes everyday in class without the teacher having to remind you to do so.
a)
Integrity
b)
Courage
c)
Self-Discipline
12.
What are the only two ways to make money?
a)
Go to College
b)
Get a job
c)
Sale something
d)
Provide a service
e)
Invent something
13.
True or False: Energy takes up space.
a)
True
b)
False
14.
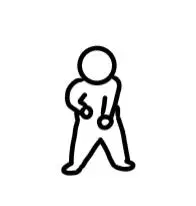
The diagram below represents
a)
Energy
b)
Matter
c)
Courage
d)
Cowards
15.

The diagram below represents
a)
Energy
b)
Matter
c)
Atoms
d)
Courage
e)
Cowards
16.

The diagram below represents
a)
Energy
b)
Matter
c)
Atoms
d)
Courage
e)
Cowards
17.
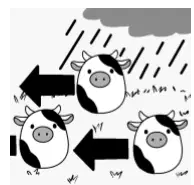
The diagram below represents
a)
Energy
b)
Matter
c)
Atoms
d)
Courage
e)
Cowards
18.
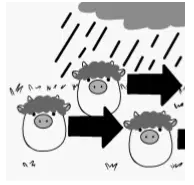
The diagram below represents
a)
Energy
b)
Matter
c)
Atoms
d)
Courage
e)
Cowards
19.

All living things are made up of....
a)
DNA
b)
Nucleus
c)
Cells
d)
None of the above
20.
Why do we need to graph data? (Choose all that apply)
a)
to make sense of the data
b)
to create a model or visual representation of the data
c)
to understand the relationship between the independent and dependent data
d)
to complete the data table
21.

What type of graph is illustrated below?
a)
Line or X/Y Scatter Plot
b)
Bar Graph
c)
Stack Bar Graph
d)
Histogram
e)
Pie Graph
22.

What type of graph is illustrated below?
a)
Line or X/Y Scatter Plot
b)
Bar Graph
c)
Stack Bar Graph
d)
Histogram
e)
Pie Graph
23.
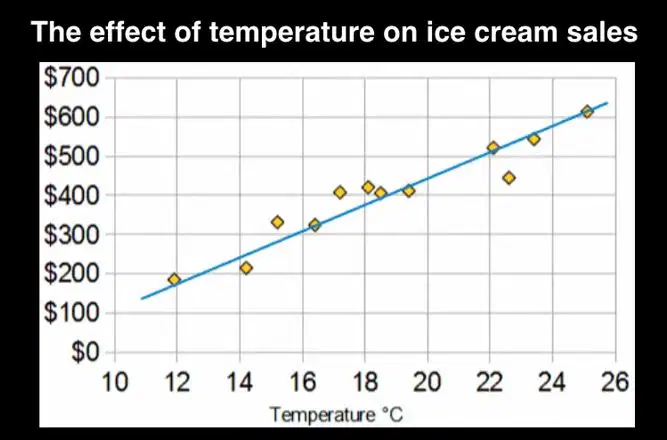
What type of graph is illustrated below?
a)
Line or X/Y Scatter Plot
b)
Bar Graph
c)
Stack Bar Graph
d)
Histogram
e)
Pie Graph
24.
What of the following graph allow for the use multiple sets of data per category?
a)
Bar Graph
b)
Pie Graph
c)
Line or X/Y Scatter Plot
25.
When should you use a Line Graph or X/Y Scatter Plot?
a)
You should use a Line graph or X/Y scatter plot when the values on the X axis are discreet categories
b)
You should use a Line graph or X/Y scatter plot when the values on the X axis are continuous or numerical
c)
When there is not need for a trend line
26.
Which of the statement below are benefits of a line graph or X/Y Scatter plot (Select all that apply)
a)
it allows for the creation of a trend line
b)
it allows for interpolation (estimation finding new data points outside our data set
c)
it allows scientist to identify the type of relationship between their independent and dependent variable
27.
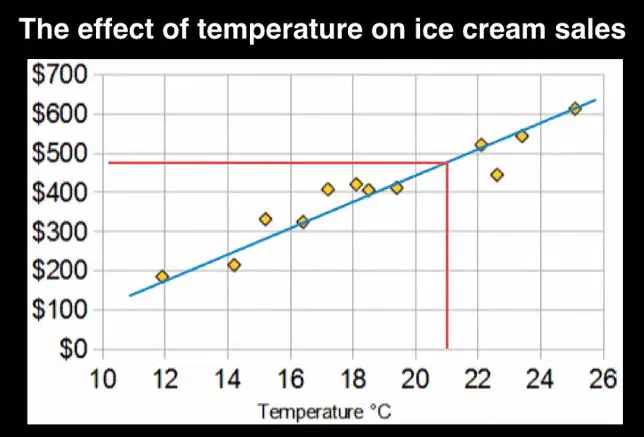
The red lines on the graphs represent which of the following? (Choose all the apply)
a)
Trend Line
b)
Interpolation
c)
Continous Data
d)
a data point from the original data was collected
28.
Which of the following actions will help guide you to success in class?
a)
Grit
b)
Gratitude
c)
Grow
d)
Give
29.
Johnny is a good student that listens and takes notes in class. He has a vocabulary quiz every Tuesday, but he always complains about having a bad memory and studies only 15 minutes on test days to prepare for the quiz. He has taken the same quiz 3 times and has the same score on all 3 quizzes. What does Johnny have to change to improve his score dramatically.
a)
Self Discipline
b)
Grit
c)
Gratitude
d)
Integrity
e)
Humility
30.
A student who thinks they know it all has no _____________.
a)
Humility
b)
Self Discipline
c)
Patience
d)
Unselfishness
e)
Integrity
31.
The Buffalo and the Cow is story about __________.
a)
Courage
b)
Self Discipline
c)
Patience
d)
Unselfishness
e)
Integrity
32.
An experiment was conducted to test the effect of fertilizer on plant growth. A group of 20 plants was divided into two equal groups. Group A was given 60mL of fertilizer per day. Group B was given 120mL of fertilizer per day and the plants were tested for 40 days. All other variables were kept constant. Why did the scientist perform the experiment describe above?
a)
to create a Hypothesis
b)
to understand a relationship in the natural world
c)
to design an experiment
d)
collect data
33.
An experiment was conducted to test the effect of fertilizer on plant growth. A group of 20 plants was divided into two equal groups. Group A was given 60mL of fertilizer per day. Group B was given 120mL of fertilizer per day and the plants were tested for 40 days. All other variables were kept constant. What is the independent variable (x) in the experiment described above?
a)
plant growth
b)
fertilizer
c)
water
d)
Group A and Group B
34.
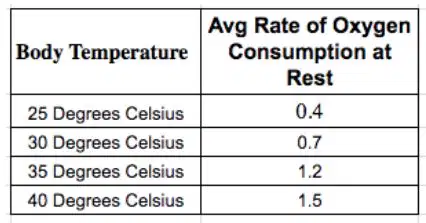
A scientist performed an experiment to see how Body Temperature affects oxygen consumption. The data he gathered is in in the table below. Which of the graphs below is the best visual representation of his data?
a)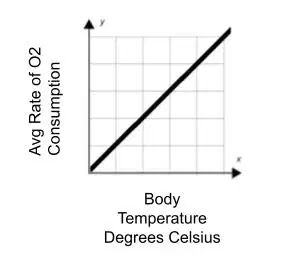
Option 5
b)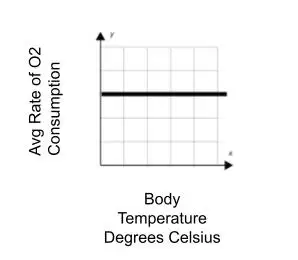
Option 1
c)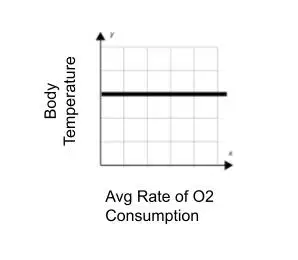
Option 2
d)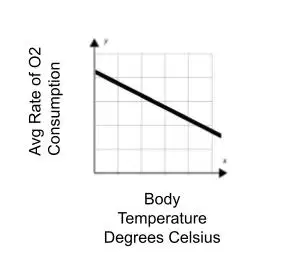
Option 3
e)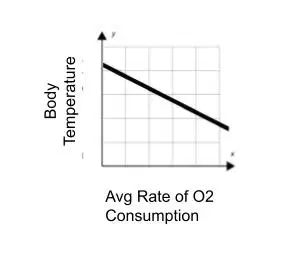
Option 4
35.
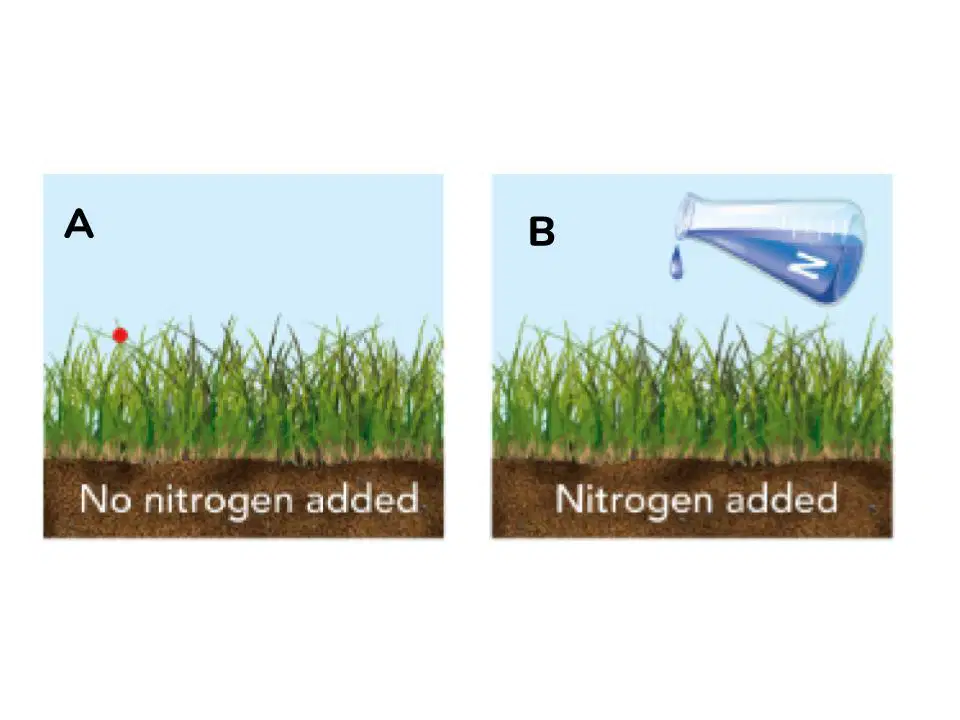
In the Salt Marsh Experiment on Figure 1-2 from your reading. Scientist designed and conducted an experiment to understand why marsh grasses grow to different heights in different places. They hypothesized that nitrogen compounds cause grass to grow faster. In their experiment, which of the following locations is the control group?
a)
Location A is the control group
b)
Location B is the control group
c)
Location A and B are the control groups
d)
Neither location is the control group because grass will grow in both locations
36.
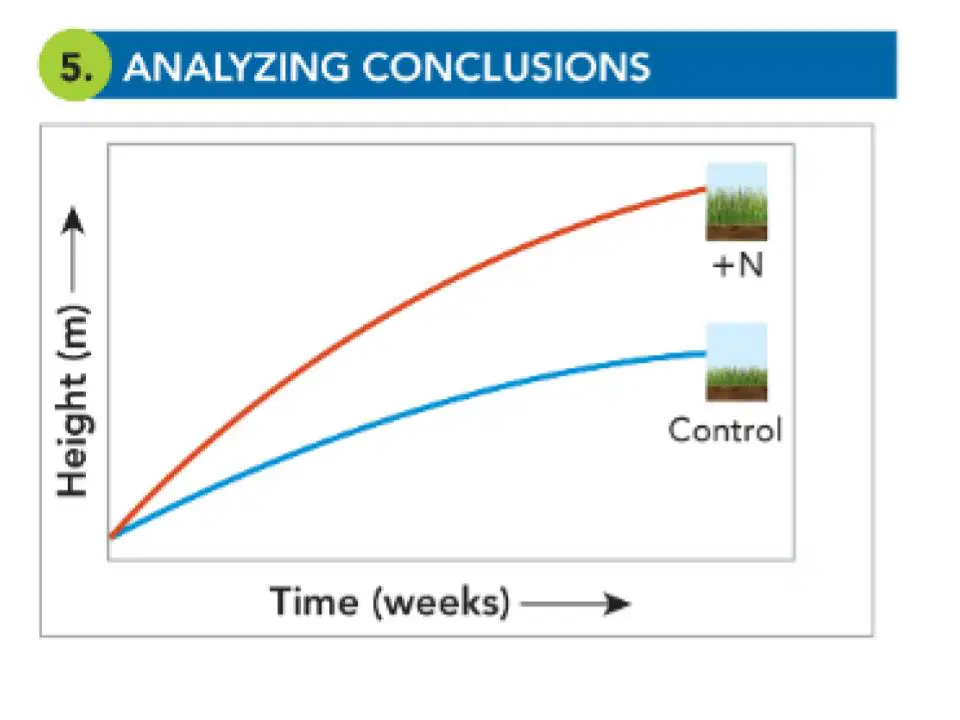
In the Salt Marsh Experiment on Figure 1-2 from your reading. Scientist designed and conducted an experiment to understand why marsh grasses grow to different heights in different places. They hypothesized that nitrogen compounds cause grass to grow faster. The scientists collected their data from their experiment and created a visual representation showned below. Based on the graph, what did the scientist conclude about the relationship between nitrogen and plant growth?
a)
Positive
b)
Negative
c)
No Relationship
d)
The scientist did not have enough data to make a conclusion
37.
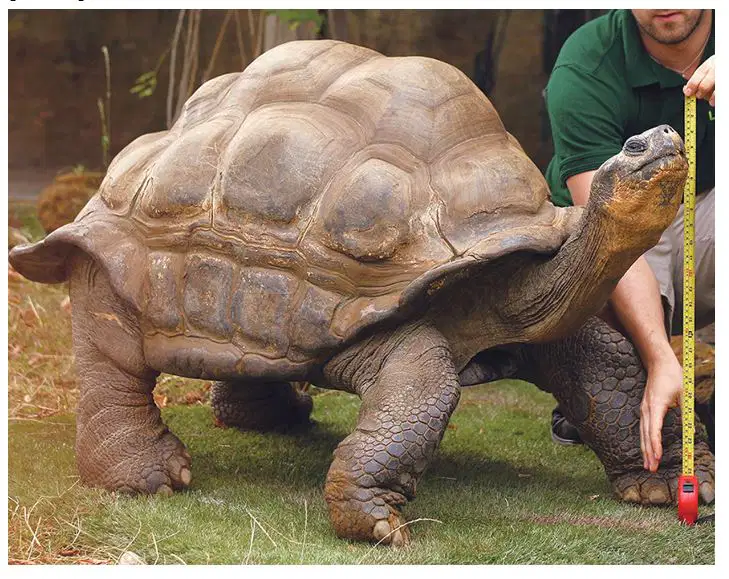
By measuring the height f the tortoise, what type of information is the scientist gathering?
a)
independent variables
b)
dependent variables
c)
quantitative data
d)
qualitative data
100 %

