
 Worksheets
Quiz on Data Analysis and Sampling
Total questions: 87
Worksheet time: 44mins
What is the PPDAC Cycle used for?
To measure temperature
To analyze data
To calculate speed
To design buildings
Which of the following is a type of sampling that is unbiased?
Convenience sampling
Random sampling
Judgmental sampling
Snowball sampling
What is the purpose of using charts for qualitative data?
To display numerical data
To show trends over time
To represent categorical data
To calculate averages
What can misleading graphs lead to?
Accurate predictions
Misinterpretation of data
Clear understanding
Precise calculations
What is one of the primary uses of statistics?
To create fictional stories
To collect, analyze, and interpret data
To design fashion trends
To paint abstract art
How do statistics help organizations before making decisions?
By providing random guesses
By offering evidence-based results and reducing uncertainty
By increasing confusion
By eliminating all risks
In which fields are statistics commonly used?
Business, health, education, and government
Cooking, painting, and music
Sports, entertainment, and fashion
Literature, poetry, and drama
What is the population in the given scenario?
The 100 surveyed customers
All 800 customers using the app
The 40% who found it easy to use
The 60% who found it challenging
Who constitutes the sample in the survey?
All 800 customers using the app
The 40% who found it easy to use
The 100 surveyed customers
The 60% who found it challenging
What is the parameter in this context?
The 100 surveyed customers
The true proportion of customer satisfaction level
The 40% who found it easy to use
The 60% who found it challenging
Identify the statistic from the survey results.
The 100 surveyed customers
The true proportion of customer satisfaction level
Both 40% and 60% obtained from the sample
All 800 customers using the app
What is the first step in the PPDAC Cycle?
Plan
Problem
Data
Analysis
In the PPDAC Cycle, what does the 'Plan' step involve?
Gathering information
Using graphs/statistics
Deciding what and how to collect
Interpreting results
Which step of the PPDAC Cycle involves using graphs and statistics?
Problem
Plan
Analysis
Conclusion
What is the purpose of the 'Conclusion' step in the PPDAC Cycle?
Define research question
Interpret results
Gather information
Decide what and how to collect
Which phase involves deciding which variables to measure?
Analysis
Conclusion
Plan
Problem
Which phase involves creating a histogram of collected data?
Analysis
Conclusion
Plan
Problem
Which phase involves deciding the issue, like: “Do students spend more time on studying or Social Media?”
Analysis
Conclusion
Plan
Problem
Which phase involves summarizing findings and giving recommendations?
Analysis
Conclusion
Plan
Problem
What type of variable is "shirt sizes (S, M, L, XL)" and what is its level of measurement?
Quantitative – Continuous
Qualitative – Ordinal
Quantitative – Discrete
Qualitative – Nominal
Identify the type and level of measurement for "daily sales revenue in AED."
Qualitative – Nominal
Quantitative – Discrete
Quantitative – Continuous
Qualitative – Ordinal
What is the type and level of measurement for "favorite smartphone brand"?
Quantitative – Continuous
Qualitative – Nominal
Quantitative – Discrete
Qualitative – Ordinal
Determine the type and level of measurement for "number of siblings."
Quantitative – Discrete
Qualitative – Ordinal
Quantitative – Continuous
Qualitative – Nominal
What type of data is collected firsthand by a researcher?
Primary Data
Secondary Data
Tertiary Data
Qualitative Data
What type of data is collected by others and reused?
Primary Data
Secondary Data
Raw Data
Processed Data
A researcher distributes questionnaires to 300 shoppers at a mall. What type of data is this?
Primary Data
Secondary Data
Qualitative Data
Quantitative Data
A teacher downloads student test scores from the Ministry of Education. What type of data is this?
Primary Data
Secondary Data
Raw Data
Processed Data
Why can survey results sometimes be generalized to an entire population?
If the sample is representative, findings can be generalized.
Because surveys are always accurate.
Due to the large number of questions.
Because they are conducted online.
How do surveys allow researchers to gather both numbers and opinions?
By including closed-ended and open-ended questions.
By using only closed-ended questions.
By asking only qualitative questions.
By focusing solely on quantitative data.
Why is it important to write survey questions clearly?
To avoid confusion and ensure valid responses
To make the survey longer
To confuse the respondents
To increase the response rate
If a company only surveys employees from one department, what challenge does this illustrate?
Inappropriate sampling; results may not represent the whole company
High response rate
Clear survey questions
Emotional questions
If only 10% of the surveyed sample replies to an emailed survey while the population size is more than 500, what is the issue?
Low response rate; results may be biased
High response rate; results are accurate
Clear questions; results are valid
Emotional questions; results are skewed
What is an observation?
Data collected by watching without interference
Data collected by conducting experiments
Data collected by asking questions
Data collected by making assumptions
Why is observation useful when participants cannot or don’t respond?
It allows for direct interaction
It provides unbiased data
It enables data collection without interference
It ensures causality
What does observation show?
Causality, not association
Association, not causality
Both causality and association
Neither causality nor association
Can observation alone prove that grooming increases pet health?
Yes, it proves causality
No, it shows association, not causality
Yes, it provides direct evidence
No, it cannot show any relationship
What is one key characteristic of an experiment?
Observing natural phenomena without interference
Applying a treatment and recording the outcome
Collecting data without any manipulation
Studying historical data
What type of relationship does an experiment allow researchers to test?
Correlational
Causal
Descriptive
Predictive
In the given scenario, why is the setup with two plants considered an experiment?
Because it involves observing plants in their natural environment
Because it involves applying a treatment to test an effect
Because it involves collecting data over a long period
Because it involves comparing different species of plants
In a drug trial, one group receives medicine, another a sugar pill. Which is the control group?
Group receiving medicine
Group receiving sugar pill
Group receiving both treatments
Group receiving no treatment
Why do researchers use a placebo?
To enhance the effects of the treatment
To ensure results are due to treatment, not psychological effects
To confuse the participants
To increase the cost of the trial
What is the term used when participants are unaware of the group they are in?
Double-blind
Single-blind
Open-label
Triple-blind
In which type of study are both participants and researchers unaware of the group assignments?
Single-blind
Double-blind
Open-label
Triple-blind
What is the main purpose of using blinding in research studies?
To increase sample size
To reduce bias
To speed up the study
To lower costs
Why might a government sample households instead of surveying every citizen?
Surveying everyone is too costly and time-consuming
It provides more accurate results
It is required by law
It ensures everyone is included
What is a sampling frame?
A list or source identifying all elements of the population
A method of data collection
A statistical analysis tool
A type of survey question
In the context of a university survey, what would typically serve as the sampling frame?
The student enrollment list
The faculty directory
The library catalog
The course syllabus
A study selects only students from one elite school to represent all students. What type of bias is this?
Non-response bias
Selection bias
Confirmation bias
Sampling bias
If 90% of people ignore an online survey, what type of bias occurs?
Response bias
Selection bias
Non-response bias
Observer bias
Why is bias problematic even with a very large sample?
Large samples always remove bias
Large non-random samples do not remove systematic error
Large samples ensure accurate results
Large samples prevent all types of bias
Which sampling method involves using a random generator to select members from the sampling frame?
Systematic Sampling
Stratified Sampling
Simple Random Sampling
Cluster Sampling
In which sampling method do you divide the population by the sample size and then select every nth member?
Simple Random Sampling
Systematic Sampling
Stratified Sampling
Cluster Sampling
What is the main characteristic of stratified sampling?
Randomly select members from the entire population
Randomly select members from each stratum
Select every nth member
Sample all members within selected clusters
Which sampling method involves dividing the population into clusters and sampling all members within selected clusters?
Simple Random Sampling
Systematic Sampling
Stratified Sampling
Cluster Sampling
Choosing 50 students randomly from a class list. Which sampling method is used?
Systematic sampling
Stratified sampling
Simple random sampling
Cluster sampling
Surveying every 10th customer entering a store. Which method is this?
Systematic sampling
Stratified sampling
Simple random sampling
Cluster sampling
Dividing students by grade level and sampling from each grade. Which method is used?
Systematic sampling
Stratified sampling
Simple random sampling
Cluster sampling
Selecting 5 entire common areas within the school during a break period. Which sampling method is this?
Systematic sampling
Stratified sampling
Simple random sampling
Cluster sampling
Surveying friends because they are easy to reach. Which type?
Convenience sampling
Volunteer sampling
Snowball sampling
Random sampling
Posting a survey online and only those who volunteer respond. Which type?
Convenience sampling
Volunteer sampling
Snowball sampling
Stratified sampling
Asking participants to refer their friends for a study. Which type?
Convenience sampling
Volunteer sampling
Snowball sampling
Systematic sampling
For a population of less than 100, what is the recommended sample size?
50% of the population
20% of the population
Survey the entire population
400 samples
If a population is less than 500, what percentage of the population is considered an adequate sample size?
10%
50%
20%
5%
What sample size is recommended for a population greater than 5000?
100 samples
200 samples
400 samples
500 samples
For a population less than 1500, what percentage of the population should be sampled?
10%
50%
20%
30%
Which chart is best for survey results showing favorite sport among students as numbers?
Pie Chart
Line Chart
Bar Graph
Radar Chart
Which chart shows sales revenue over 12 months?
Histogram
Line Chart
Pie Chart
Bar Graph
Comparing performance of two departments across 5 metrics. Which chart?
Pie Chart
Histogram
Radar Chart
Line Chart
What is the formula for calculating relative frequency?
Frequency / Total
Total / Frequency
Frequency x Total
Total - Frequency
How do you calculate the percentage from the relative frequency?
Relative Frequency x 100%
Relative Frequency / 100%
Relative Frequency + 100%
Relative Frequency - 100%
If the total sales recorded are 200, what is the relative frequency of cleaning products sold?
0.30
0.25
0.20
0.15
What is the percentage of fruits sold if the frequency is 35 and the total is 200?
17.5%
15%
12.5%
10%
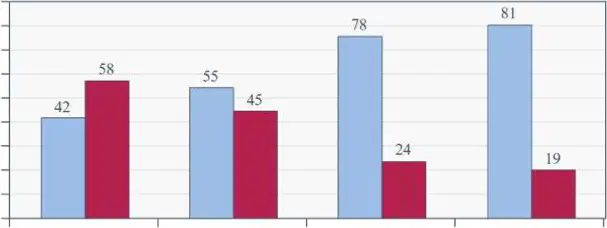
If there are 800 first-year students, how many of them own a credit card?
336 students
400 students
500 students
200 students
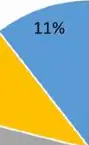
Based on the pie chart, what percentage of time does the instructor spend on “meetings and other events”?
11%
21%
47%
10%
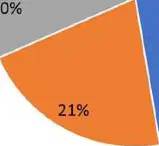
If a university instructor works 40 hours per week, how many hours are spent on preparing teaching materials?
8.4 hours
10 hours
12 hours
6 hours
What is the formula for calculating class width?
(Maximum Value + Minimum Value) / Number of Classes
(Maximum Value - Minimum Value) / Number of Classes
(Maximum Value * Minimum Value) / Number of Classes
(Maximum Value / Minimum Value) * Number of Classes
Given the temperatures: 17, 19, 23, 24, 38, 40, 45, 43, 32, 30, 22, 19, what is the class width if the data is divided into 7 classes?
3
4
5
6

Identify the shape of this distribution.
Left Skew
Symmetric
Right Skew
Uniform
What is the primary purpose of a line chart?
To show trends over time
To compare different categories
To display parts of a whole
To illustrate geographical data
According to the line chart, when does the sales peak occur?
March
May
June
December
What happens to the sales in June according to the line chart?
They increase steadily
They reach a peak
They drop suddenly
They remain constant
Which of the following is a common issue with misleading graphs?
Non-zero baseline
Consistent scaling
Accurate data representation
Clear labeling
What problem arises when pie charts do not sum to 100%?
They provide a clear comparison
They accurately represent proportions
They mislead the viewer
They enhance data clarity
How can 3D charts distort perception?
By providing accurate data
By enhancing visual appeal
By making data appear more significant than it is
By simplifying data interpretation
What is a potential issue with using pictures without proportionality in graphs?
They enhance data accuracy
They can mislead viewers about the data's significance
They provide a clear representation
They simplify complex data
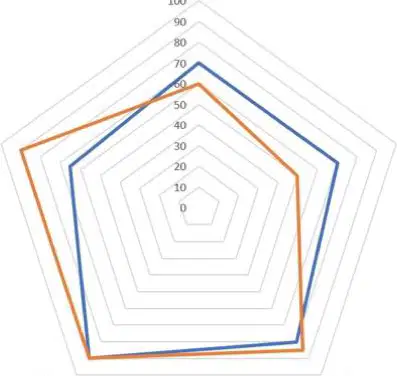
What is the primary use of a Radar Chart?
To compare multiple quantitative variables
To display a single variable over time
To show the distribution of data
To illustrate hierarchical data
In a Radar Chart, what does each axis represent?
A variable
A data point
A time period
A category

