
NEW
Font size
 Worksheets
STATES
Total questions: 50
Worksheet time: 31mins
The Poisson distribution is typically used for which of the following?
Counting rare events over a continuous interval
Modeling outcomes with equal probability
Measuring samples with a high standard deviation
Comparing continuous data with a median
The normal distribution is also known as:
J-shaped curve
Linear curve
Bell-shaped curve
Skewed curve
If every value within a certain range has the same probability, which distribution is this?
Binomial Distribution
Uniform Distribution
Normal Distribution
Poisson Distribution
What measure of central tendency is calculated by adding all the values and dividing the sum by the number of values?
Mode
Median
Mean
Fractiles
Which of the following statements about a normal distribution is true?
It is not symmetrical
The mean, median, and mode are different
Most data points cluster around the mean
It is used only for discrete data
Which real-world data set is most likely to follow a normal distribution?
The number of rare birds sighted in a wildlife preserve
Water quality readings from random sampling locations along a river
Heights of a large group of people
The probability of germination success for seeds in a controlled experiment
For the Poisson distribution, which statement is true about the mean and variance?
Mean is greater than the variance
Mean is less than the variance
Mean and variance are equal
Mean is not related to the variance
Which of the following is NOT a characteristic of a binomial distribution?
Only two possible outcomes per trial
Trials are independent
The probability of success changes each trial
It is used for a fixed number of trials
The Central Limit Theorem states that as sample size increases, the sampling distribution of the sample mean will:
Remain skewed
Approach a normal distribution
Become bimodal
Approach a uniform distribution
A confidence interval is:
A single value estimate of the population mean
A range within which the true population parameter is expected to fall
Used only when the sample standard deviation is unknown
Not related to the sample mean
When calculating a 95% confidence interval with a large sample size, which z-score should be used?
0.5
1.96
2.58
2.16
Find the z-score for a data point of 70 when the mean is 60 and the standard deviation is 5.
0.5
1
2
-1
Calculate the 95% confidence interval for a sample mean of 4.1 kg, with a standard deviation of 0.6 kg and sample size of 20. Use t-score 2.093.
3.631 – 4.651
3.821 – 4.454
3.837 – 4.363
3.819 – 4.381
An ecologist wants to calculate a 95% confidence interval for the mean leaf nitrogen content in a certain forest region. She collects a random sample of 18 trees and calculates a sample mean of 2.8% nitrogen with a standard deviation of 0.3%. Given the sample size, which confidence interval method should she use, and why?
Z-interval, because the sample size is greater than 10.
Z-interval, because the population standard deviation is known.
T-interval, because the sample size is less than 30, and the population standard deviation is unknown.
T-interval, because all environmental data must be analyzed with a t-distribution.
How many decimal places does the number 0.0567 have?
1
2
3
4
How many significant figures does the number 150.07 have?
2
3
4
5
Which of the following is true about decimal places?
They represent the total number of digits in a number.
They include leading zeros.
They refer to the digits to the right of the decimal point.
They only apply to whole numbers.
Which of these numbers has exactly 3 significant figures?
0.040
45.0
150.00
0.001450
If a number is rounded from 3.1459 to 4 significant figures, what is the result?
3.145
3.146
3.140
3.160
Midterm exam scores for a small advanced biostat class are provided below. Scores represent percent of items marked correct on the exam. 87 99 75 87 94 75 35 88 87 93. What is the Range of the scores?
46
52
64
77
The mean weight of five fig fruits is 16.72 pounds. The weights of four of the fig fruits are 15.84 pounds, 16.28 pounds, 16.5 pounds, and 17.82 pounds respectively. What is the weight of the fifth fruit?
16.12
17.16
16.68
17.05
What is the median score achieved by a student who recorded the following scores on 10 math quizzes? 68, 55, 70, 62, 71, 58, 81, 82, 63, 68.
68
70
69
71
Which graph type is most suitable for showing the distribution of continuous data?
Bar plot
Pie chart
Histogram
Line chart
In a class of 100 students, Arvin obtained a score of 25 which is the 50th percentile. This implies that his score is ______.
below the 3rd Quartile
above the 3rd quartile
above the 75th percentile
Two of the above answers are true
Last year a small statistical consulting company paid each of its five statistical clerks P22,000, two statistical analysts P50,000 each, and the senior statistician/owner P270,000. The number of employees earning less than the mean salary is:
0
4
5
7
What type of chart is typically used to display percentages of categorical data?
Bar plot
Pie chart
Histogram
Line chart
If you round the number 7892 to 2 significant figures, what is the result?
7800
7900
780
79
Which of the following statements is true about bar plots and pie charts?
Both are ideal for showing continuous data.
Pie charts show absolute quantities, while bar plots show percentages.
Bar plots are usually preferred over pie charts in scientific contexts.
Bar plots cannot be used to infer percentages.
How many significant figures does the number 0.045000 have?
2
3
5
6
In scientific notation, how is 4500 expressed with 2 significant figures?
4.5×10³
45×102
450×101
0.45×10⁴
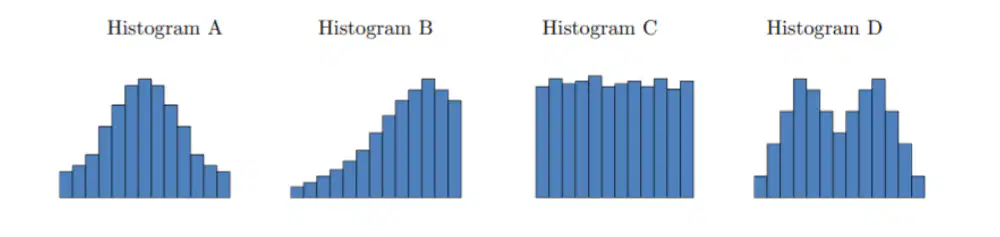
Which histogram depicts a normal distribution?
Histogram A
Histogram B
Histogram C
Histogram D
For the values (10, 15, 20, 25, 30), which of the following measures would not change if 20 was replaced by 25?
mean
median
mode
range
What is the median of the dataset {3, 7, 8, 12, 15}?
7
8
10
12
What is the primary advantage of using a histogram?
It shows exact values for each category.
It can represent categorical data effectively.
It provides a clear view of data distribution.
It is used to show central tendency only.
What statistical measure represents the value that appears most frequently in a dataset?
Mean
Median
Mode
Range
A given distribution for the scores of 27 students has a second quartile of 33. Which statement about this is NOT true?
The 50th percentile is also 33.
The median score is 33.
Fifty percent of the students got a score less than or equal to 33.
Fifty percent of the students attained a score of exactly equal to 33.
What is the second quartile in the following numbers? 45, 12, 34, 12, 65
45
65
12
34
Which statement about quartiles or percentiles is NOT true?
There is a 5th quartile.
Quartiles and Percentiles are positional measures.
There are 100 percentiles.
It is possible to have a 4th quartile.
The normal bell curve is symmetric about the mean.
True
False
Sometimes True
Always False
For a standard normal distribution the value of the mean is equal to?
2
∞
0
1
Which of the following best describes a platykurtic distribution?
A distribution with a high peak and thin tails
A distribution with a low peak and thin tails
A distribution with a high peak and thick tails
A distribution with a low peak and thick tails
Which measure of spread is considered more "robust" than the range because it is less affected by extreme values?
Variance
Mean
Standard Deviation
Interquartile range
If a dataset has a mean of 5 and a standard deviation of 0.25, what is the coefficient of variation (CV)?
5%
10%
15%
20%
In a recent survey conducted among soil levels near a factory, the distribution of the soil levels was found to be positively skewed. Which statement is correct regarding the relationship between the mean and median scores?
The mean is less than the median.
The mean is greater than the median.
The mean equals the median.
The distribution has no skew.
In a dataset with values primarily near the mean, the standard deviation is likely to be:
High
Low
Zero
Undefined
Which term best describes a distribution with a high peak and many values close to the center?
Mesokurtic
Platykurtic
Leptokurtic
Asymptotic
Given the dataset for Plant A (4.9, 5.3, 5.0, 4.7, 5.1, 5.0, 5.0), what is the interquartile range (IQR)?
0.10
0.2
0.175
0.5
If the standard deviation of a sample is 0.111, what is the approximate variance?
0.012
0.111
0.123
0.022
Which of the following datasets would have a higher standard deviation?
A dataset with values all close to the mean
A dataset with values spread out from the mean
A dataset with zero variance
A dataset with a negative variance
A distribution with a right tail sticking out is described as:
Left-skewed
Right-skewed
Symmetrical
Platykurtic

