
 Worksheets
IPP3 Exam 2
Total questions: 60
Worksheet time: 30mins
Which term is defined as “the probability of detecting a difference that does NOT actually exist”?
Power
Beta
Alpha
Confidence interval
Which term is defined as “data that has categories with no specific order”?
Nominal
Ordinal
Interval
Ratio
Which term is “data with a specific order but without uniform or measurable spacing between values”?
Interval
Ratio
Nominal
Ordinal
Which definition best describes interval data?
Ordered values with equal spacing and a true zero
Values with no true zero
Categories without order
Whole-number counts
Which term describes “data with an absolute zero”?
Ordinal
Ratio
Interval
Nominal
Which term is defined as “data that can take on any value within a range, with infinite measurable points between two values”?
Discrete
Continuous
Ordinal
Nominal
Which term describes “whole number data that cannot include fractions”?
Continuous
Discrete
Nominal
Which term is defined as “a linear measure of the degree of relationship between two variables”?
R²
Correlation coefficient
Hazard ratio
Alpha
Which term means “a range of values in which the true population value is likely to lie”?
p-value
Correlation
Confidence interval
NNT
Which term is defined as “an under- or over-estimation of an effect due to flaws in study design”?
Bias
Confounding
Random error
Power
Which term refers to “a variable outside the exposure that influences the outcome, creating a false association”?
Dependent variable
Independent variable
Confounding variable
Nominal variable
Which term means “the probability of failing to detect a real difference when one actually exists”?
Type I error
Type II error
Confidence interval
Power
Which term describes “the accuracy of the study results within the population that was actually studied”?
External validity
Internal validity
Power
Strength of evidence
Which term means “the ability to generalize trial results to a broader population”?
External validity
Internal validity
Confidence interval
Correlation
Which term is defined as “a graphical method used to estimate survival over time”?
Kaplan-Meier curve
Scatter plot
Logistic regression
Forest plot
Which term describes “the rate at which an event occurs in the treatment group compared with the control group over time”?
Odds ratio
Relative risk
Hazard ratio
Beta
Which term is defined as “the probability that a reported difference is due to random chance”?
Beta
p-value
R²
Power
Which term refers to “a non-parametric test used to analyze paired ordinal data”?
Mann–Whitney U test
Pearson correlation
Wilcoxon Signed-Rank test
T-test
Which term refers to “the average distance of data points from the mean in a normal distribution”?
Standard error
Median
Standard deviation
Mode
Which term describes “skewness in a dataset where the tail extends toward higher values”?
Positively skewed
Negatively skewed
Normal distribution
Bimodal distribution
Which term refers to “a test to compare means across three or more normally distributed groups”?
Fisher’s Exact test
ANOVA
Mann–Whitney
Log-rank test
Which term describes “a non-parametric test used to determine if survival curves significantly differ”?
Log-rank test
Chi-square test
Wilcoxon Signed-Rank
Pearson correlation
Which term describes “the single most frequent value in a distribution”?
Mean
Median
Mode
Range
Which term is defined as “data values that occur in a perfect bell-shaped distribution”?
Skewed distribution
Nominal distribution
Normal distribution
Modal distribution
Which term describes “a ratio of the odds of an event occurring in one group compared with another”?
Relative risk
Hazard ratio
Odds ratio
R²
Which term is defined as “the proportion of individuals with an event in the treatment arm divided by the proportion with the event in the control arm”?
Relative Risk
Absolute Risk
Odds Ratio
Hazard Ratio
Which term describes “the percentage decrease in risk in the treatment group compared with the control group, calculated as 1 – RR”?
Absolute Risk Reduction
Relative Risk Reduction
Number Needed to Treat
Odds Ratio
Which term is defined as “the number of patients that must be treated for one patient to experience harm”?
Number Needed to Treat
Number Needed to Harm
Absolute Risk Reduction
Risk Ratio
Which term is used to describe “the risk of an adverse event at any point in time when comparing treatment vs. control”?
Hazard Ratio
Relative Risk
Odds Ratio
Beta Value
Which term defines “the middle value of a dataset when values are arranged in order”?
Mean
Median
Mode
Standard Deviation
A new drug reduces the rate of migraine attacks from 30% (placebo) to 20% (treatment).
What is the NNT?
3
5
7
10
A medication lowers the incidence of stroke from 12% in the control group to 8% in the treatment group.
What is the NNT?
12
25
33
50
In a trial, 18% of untreated patients experienced heart failure hospitalization, compared with 15% of patients on Drug A.
17
34
67
50
A COPD inhaler reduces annual exacerbations from 40% to 25%.
What is the NNT?
3
6
7
10
A vaccine lowers infection rates from 16% to 4%.
What is the NNT?
5
8
9
12
A pain medication causes dizziness in 14% of users vs 8% on placebo.
What is the NNH?
8
12
16
25
A diabetes drug increases nausea from 15% to 22%.
What is the NNH?
6
9
14
25
A lipid-lowering drug increases myalgia from 2% to 5%.
What is the NNH?
10
33
34
3
An antidepressant increases insomnia from 9% to 14%.
What is the NNH?
6
11
17
20
A new antiviral increases diarrhea from 18% to 30%.
What is the NNH?
12
6
8
9
In a study of pneumonia prevention, 10% of vaccinated patients developed pneumonia compared with 20% of unvaccinated patients.
What is the Relative Risk (RR)?
0.25
0.50
1.00
2.00
A new diabetes drug caused hypoglycemia in 6% of users vs. 3% in the placebo group.
What is the RR?
0.50
1.00
2.00
0.25
In a cardiovascular trial, MI occurred in 12% of the treatment group and 15% of the control group.
RR = ?
0.60
0.80
1.25
2.50
A weight-loss drug caused GI upset in 25% of patients vs 10% on placebo.
RR = ?
0.40
1.50
2.50
3.00
A vaccine prevented flu in 96% of patients (4% got flu). In the placebo group, 10% got flu.
RR = ?
0.40
0.96
9.6
4.0
A medication reduces stroke from 12% in the control group to 9% in the treatment group.
What is the ARR?
1%
2%
3%
6%
A cholesterol drug lowers MI risk from 8% to 5%.
What is the ARR?
1%
2%
3%
5%
A biologic treatment reduces hospitalization from 22% to 17.6%.
ARR = ?
2.4%
3.2%
4.4%
5.2%
A prophylaxis therapy reduces infection from 9% to 6.2%.
ARR = ?
1.8%
2.0%
2.8%
3.0%
A cancer therapy reduces mortality from 12.4% to 9.9%.
ARR = ?
1.5%
2.0%
2.5%
3.0%

Researchers compare systolic BP (mmHg) between two independent groups.
Data are continuous and normally distributed.
Which statistical test is most appropriate?
Mann–Whitney U
Independent t-test
Paired t-test
Chi-square

A study compares proportion of GI bleeding between Treatment and Placebo groups:
Outcome is categorical (yes/no) and sample size is large.
Which test should be used?
Chi-square
Fisher’s Exact
ANOVA
Paired t-test

A pharmacist compares pain scores (1–10) between two groups after a procedure.
Distribution is skewed and the data are ordinal.
Which test should be used?
Mann–Whitney U
Independent t-test
Chi-square
Fisher’s Exact

A pre/post study evaluates A1c (%) before and after therapy in the same individuals.
Data are paired and continuous, normally distributed.
Which test?
Paired t-test
Mann–Whitney U
Wilcoxon Signed-Rank
ANOVA
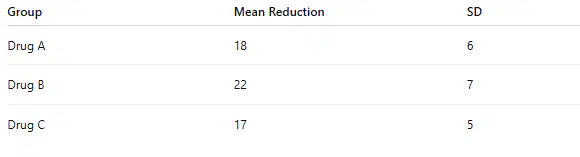
Three antihypertensives are compared for effect on LDL reduction (mg/dL):
Data are continuous and normal, comparing three groups.
Which test?
Chi-square
ANOVA
Kruskal–Wallis
Pearson correlation

A study evaluates time to hospitalization (days) for two treatments.
Outcome is time-to-event.
Which test?
Mann–Whitney U
Kaplan–Meier with Log-Rank
ANOVA
Chi-square

Infection rates in small sample sizes:
Groups are small (n < 20).
Which test?
Fisher’s Exact
Chi-square
Independent t-test
Paired t-test
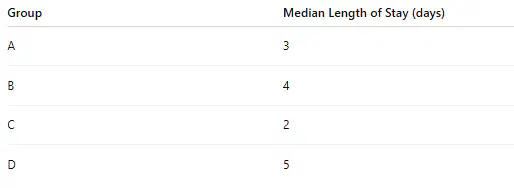
Four groups have skewed continuous data (non-normal):
Outcome = non-normal, ordinal, 4 groups.
Which test?
ANOVA
Kruskal–Wallis
Paired t-test
Mann–Whitney U

Relapse rates in three groups:
Categorical outcome, 3 groups.
Which test?
Chi-square
ANOVA
Fisher’s Exact
McNemar’s test

Before/after satisfaction scores (ordinal) for the same patients:
Paired ordinal data.
Which test?
Paired t-test
Wilcoxon Signed-Rank
Mann–Whitney U
Chi-square

