
NEW
Font size
 Worksheets
Monte Carlo Simulation: Core Concepts
Total questions: 26
Worksheet time: 13mins
Which statement best defines Monte Carlo Simulation in quantitative analysis?
It removes randomness to simplify decision calculations
It guarantees precise forecasts under all conditions
It predicts one exact deterministic outcome for a model
It models uncertainty by generating many random scenarios
Which example illustrates the intuition behind Monte Carlo methods using a dice analogy?
Rolling a single die gives the exact future outcome
Rolling thousands of dice reveals a distribution of outcomes
Rolling two dice eliminates uncertainty in results
Rolling dice is unrelated to probability distributions
What is the primary reason Monte Carlo Simulation is important in business decision-making?
It focuses only on average outcomes for simplicity
It incorporates uncertainty to reveal risk profile and extremes
It replaces probabilistic thinking with fixed estimates
It ensures confidence intervals are unnecessary
Match each probability distribution to a typical use case in Monte Carlo modeling.
Uniform: most likely values; Bernoulli: maximum values; Normal: minimum values
Triangular: success or failure; Bernoulli: demand; Normal: random variations
Bernoulli: continuous ranges; Normal: binary success; Uniform: expert estimates
Normal: demand forecasting; Uniform: random variations; Triangular: expert estimates
What sequence correctly describes the key components in running a Monte Carlo Simulation?
Deterministic inputs, no distributions, manual estimates
Single-point inputs, fixed output, one calculation
Average inputs, probability ignored, limited repetitions
Uncertain inputs, distributions, random sampling, iterations
Which step comes immediately after identifying uncertain inputs in a Monte Carlo simulation workflow?
Define decision recommendations based on insights
Recalculate the model for thousands of iterations
Store results using averages and percentiles
Build the formula or business model linking inputs to outputs
A company simulates demand with mean 500 units and standard deviation 120 units. Selling price is ₹50 and cost is ₹30 per unit. Which profit formula should be used per run?
Profit equals Demand times (Price minus Cost)
Profit equals Demand minus (Price times Cost)
Profit equals Price minus Cost divided by demand
Profit equals Demand multiplied by price plus cost
Which output metric best helps assess risk of losing money in the profit simulation?
Expected average outcome across all runs
Most likely single profit outcome
Probability that profit is less than zero
Maximum profit observed in the simulations
You must advise whether to launch the product after 1,000 simulation runs. Which approach demonstrates strategic use of results?
Use one random run that looks favorable
Ignore percentiles and focus on average demand
Compare expected profit and loss probability together
Only check the highest simulated profit value
Which statement best describes what a percentile-based range (e.g., 5th to 95th percentile) communicates in Monte Carlo results?
It removes uncertainty from future projections
It guarantees outcomes will fall within fixed bounds
It presents a realistic distribution of possible outcomes
It shows a single most likely outcome for planning
A portfolio manager wants to estimate the likelihood of losses across market scenarios. Which Monte Carlo business application fits this need?
Inventory optimization in warehouses
Campaign ROI prediction in marketing
Portfolio risk estimation in finance
Lead time estimation in logistics
A product team must choose between three launch strategies under volatile demand. Which use case most directly supports this decision with simulated likelihoods?
Resource planning and capacity analysis
Option valuation for derivatives
Credit risk assessment for borrowers
Scenario planning under market uncertainty
In an Excel Monte Carlo setup, which function combination generates a normally distributed demand value with mean 10,000 and standard deviation 2,000?
NORM.S.INV(RAND(), 10000, 2000)
RAND(NORM.INV(), 10000, 2000)
NORM.DIST(RAND(), 10000, 2000)
NORM.INV(RAND(), 10000, 2000)
Which variable is modeled with a uniform distribution in the described setup?
Profit across simulation trials
Unit cost averaging $30
Demand with mean 10,000 units
Sale price between 50and 70
You need to populate an Excel column with random demand per trial. Which simple procedure should you apply?
Use NORM.DIST with cumulative set to TRUE
Enter NORM.INV(RAND(), 10000, 2000) and fill down
Enter RAND() once and copy-paste as values
Type the mean 10000 in all rows
Why is Monte Carlo simulation chosen in the business scenario for the wearable tracker?
To eliminate pricing fluctuations entirely
To guarantee exact sales forecasting
To estimate profitability under uncertainty
To replace historical analysis completely
A student sets sale price using =RAND()*(70-50)+50. Which conceptual understanding does this reflect?
Exponential distribution with mean $60
Triangular distribution with max at $70
Normal distribution centered at $60
Uniform distribution over the 50– 70 range
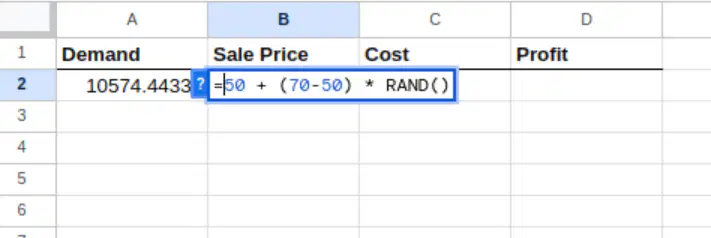
In Excel, which formula creates a uniform distribution for a selling price between 50and 70?
=AVERAGE(50, 70) + RAND()
=RANDBETWEEN(50, 70) / 100
=50 + (70-50) * RAND()
=NORM.INV(RAND(), 60, 10)
What is the role of RAND() when used inside NORM.INV in Excel?
Defines the standard deviation parameter
Provides a random probability between 0 and 1
Sets the mean for the normal distribution
Scales the output to a fixed interval
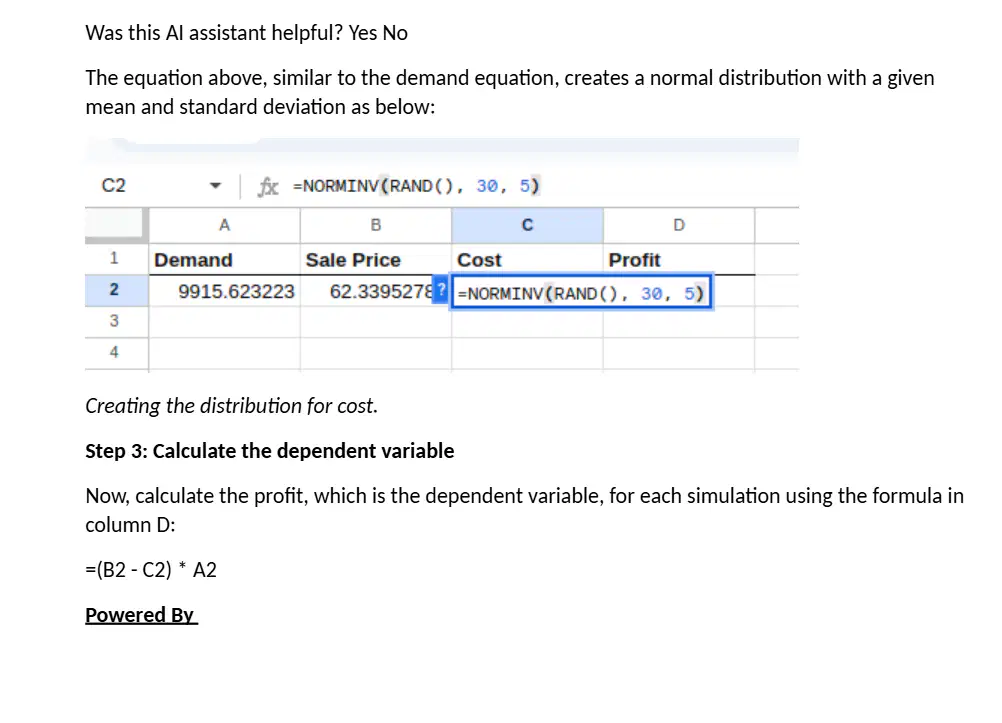
Which Excel formula generates cost values with a normal distribution mean of 30 and standard deviation of 5?
=STDEV(RAND(), 30, 5)
=NORM.DIST(30, 5, TRUE)
=AVERAGE(RAND()) + 5
=NORM.INV(RAND(), 30, 5)
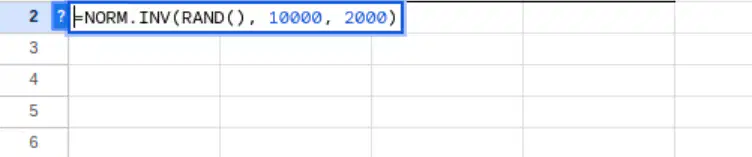
You need demand values normally distributed with mean 10,000 and standard deviation 2,000. Which setup mirrors the example?
=AVERAGE(10000) + STDEV(2000)
=NORM.INV(RAND(), 10000, 2000)
=RANDBETWEEN(8000, 12000)
=NORM.DIST(10000, 2000, TRUE)
Why might a uniform distribution be chosen for selling price while a normal distribution is used for cost?
Price constrained within a range; cost centered with dispersion
Price follows bell curve; cost fixed without variance
Price unpredictable entirely; cost strictly linear
Price always equals cost; cost is random noise
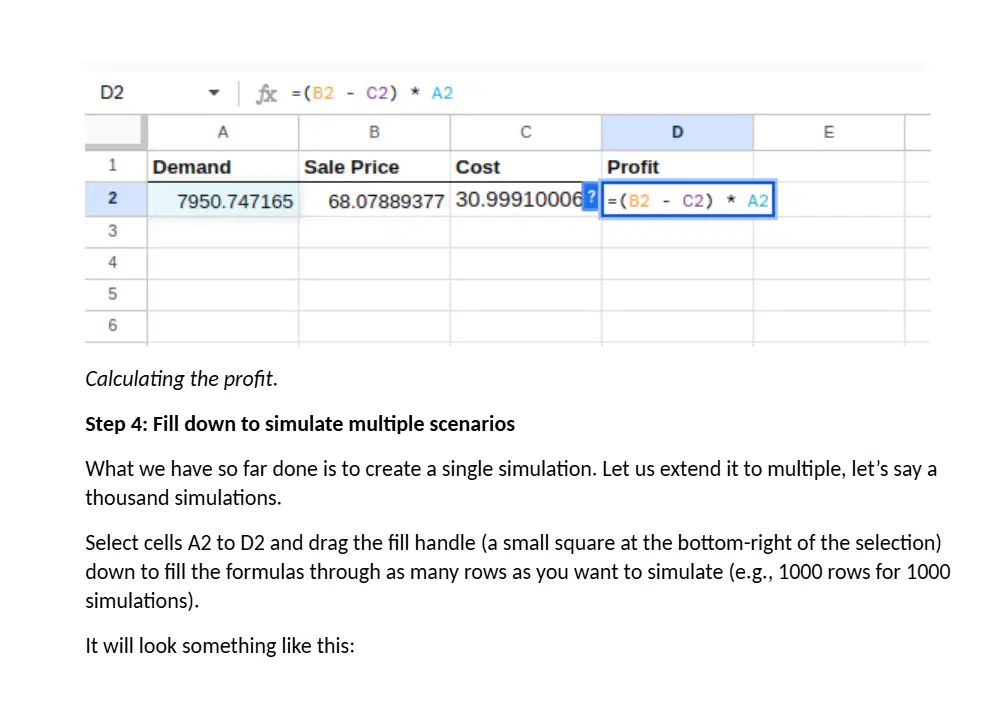
In the worksheet, the Profit in D2 is computed from Demand in A2, Sale Price in B2, and Cost in C2. Which formula best represents this profit calculation?
=(B2 / C2) * A2
=(C2 - B2) * A2
=(B2 - C2) * A2
=(B2 + C2) * A2
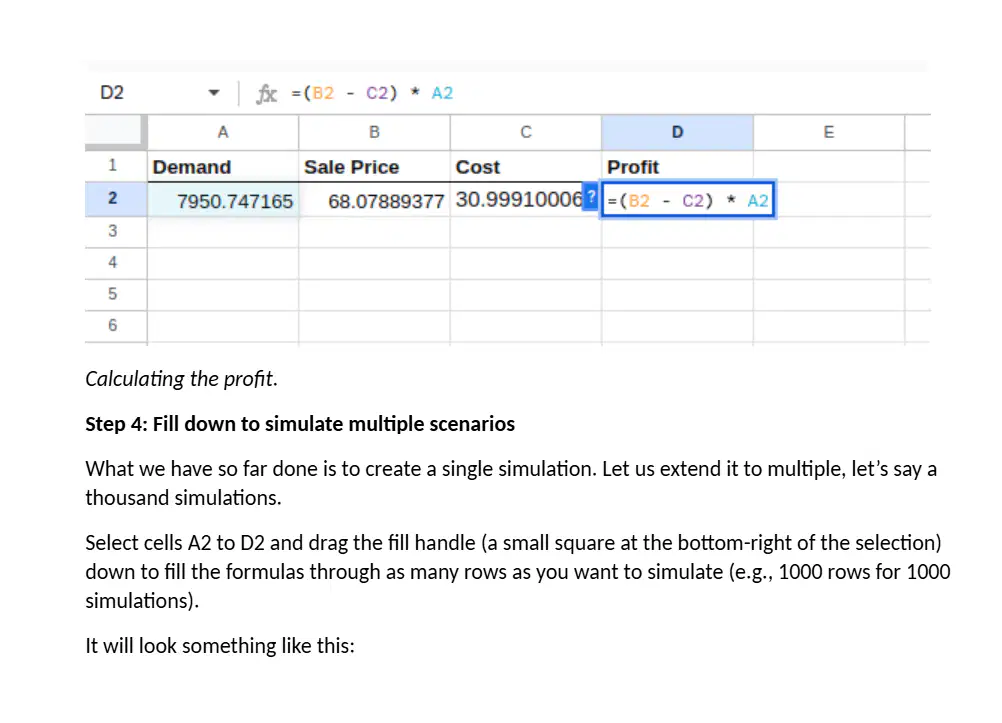
You want to simulate 1,000 scenarios using the existing formulas in A2:D2. What is the most efficient Excel action to copy formulas down through 1,000 rows?
Use Paste Formulas for each row
Reenter formulas for all rows
Press F9 repeatedly per row
Drag the fill handle down the range
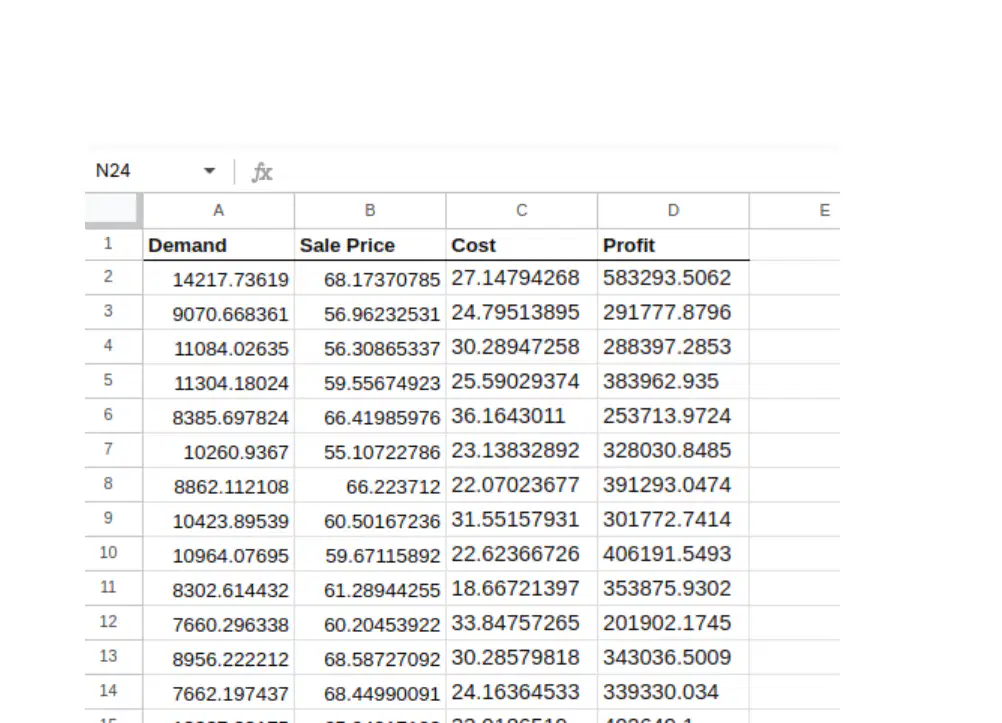
After generating profits in D2:D1001, which function will return the average expected profit?
=SUM(D2:D1001)
=STDEV(D2:D1001)
=MEDIAN(D2:D1001)
=AVERAGE(D2:D1001)
Which action most directly reduces random fluctuation in Monte Carlo outcomes when parameters are highly variable?
Use smaller time steps without changing runs
Decrease runs while tightening model scope
Increase runs to better average variability
Keep runs constant but add more variables
Switch to uniform distributions for all inputs

