
Font size
 Worksheets
At a Glance
Total questions: 121
Worksheet time: 1hrs 1mins
Which occupations are projected to see rising demand by 2030 in a midpoint adoption scenario of AI and automation?
Customer service representatives
Office clerks and production workers
STEM-related and healthcare roles
Low-skill manual service roles
Up to what share of current hours worked could be automated by 2030 with generative AI accelerating adoption?
More than fifty percent of hours
Up to thirty percent of hours
Roughly twenty percent of hours
About ten percent of hours
By 2030, how many occupational transitions could Europe require, and how does this compare with the prepandemic pace?
Roughly 3 million, half pace
Up to 12 million, about double
Around 6 million, about equal
Over 20 million, triple pace
Which combination best reflects the most needed skills upgrades as demand for physical and manual skills stabilizes?
Teaching and retraining skills
Critical thinking and creativity
Basic literacy and numeracy
Advanced IT and data analytics
What is a key risk if workers with lower wages do not acquire new skills during the transition?
Declining need for retraining programs
Rapid wage growth for low-wage jobs
More higher-wage jobs than workers
A less polarized labor market
Which scenario could help Europe achieve up to 3 percent annual productivity growth through 2030?
Prioritizing physical over digital capital
Slow automation with minimal reskilling
Delaying AI deployment and hiring freezes
Accelerated tech adoption with redeployment
Which occupations are likely to see reduced demand as AI and automation scale?
Office workers and production staff
STEM roles and healthcare staff
E-commerce and infrastructure staff
Advanced analytics and IT staff
What outcome is associated with slow worker redeployment under AI-driven change?
Millions productively participating
Balanced demand across all occupations
Millions unable to participate productively
Productivity growth near three percent

Which long-run shift best characterizes employment changes in Europe and the United States since the 19th century?
From services toward heavy manufacturing
From agriculture and industry toward services
From manufacturing toward agriculture and mining
From services toward agriculture and mining
Which recent shock accelerated hiring shifts, job switching, and new preferences such as hybrid work?
The COVID-19 pandemic
The 1970s oil shocks
The 2008 financial crisis
The eurozone debt crisis
In both Europe and the United States, what trend indicates labor market tightness?
Falling wages and increased underemployment
Stable vacancies and rising participation rates
Rising unfilled vacancies and historically low unemployment
Declining unfilled vacancies and higher unemployment
Which statement best describes the distribution of time saved from not commuting in hybrid work?
Nearly all time lost due to coordination costs
Most time reallocated fully to paid work tasks
Only about 40 percent reallocated to work, rest to leisure or caregiving
Majority reallocated to training and upskilling
Why is productivity crucial for firms competing in tight labor markets?
It allows firms to avoid hiring altogether
It reduces product quality to cut costs
It guarantees wage reductions across sectors
It enables more output or higher quality with same resources
Which chain reaction is a typical outcome when productivity rises in one sector?
Immediate decline in research and development
Job losses across related industries
Reduced investment in information technology
Stimulated job growth and new roles in adjacent areas
What long-term pattern has Europe experienced since the 1960s regarding productivity growth?
Accelerating productivity growth versus the US
Large gains after the 1990s technology boom
Stable productivity growth with minor cycles
Almost steady decrease in productivity growth
Compared with US peers, where do European companies typically lag, indicating systemic rather than cyclical issues?
Revenue growth
Unit labor costs
Research and development
Return on invested capital
Capital expenditure
Which historical factor helps explain Europe’s productivity gap with the United States since the 1990s?
Slower adoption of information and communications technology
Lower exposure to globalization in the 1980s
Earlier adoption of information and communications technology
Higher average working hours per employee
In which areas do European companies still maintain an edge relative to US counterparts, according to the research?
Cleantech
Next‑generation materials
Social media platforms
Traditional retail logistics
Coal mining equipment

What is the central question posed about technology in addressing Europe’s labor challenges by 2030?
Whether technology will reduce trade deficits
To what extent technological disruption can solve labor shortages
If technology can eliminate the public sector entirely
Whether technology will stop population aging immediately
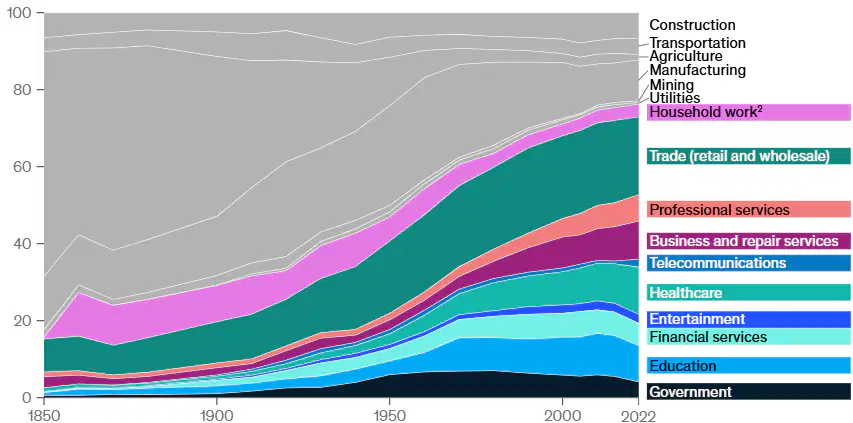
Which sectors have notably expanded their employment shares over time in both Europe and the US, as shown in the exhibit?
Financial services
Professional services
Healthcare
Household work
Agriculture
What demographic and work‑hour dynamics make Europe’s tight labor markets unlikely to ease naturally?
Aging populations
Falling hours worked per worker
Rising fertility rates
Large influx of prime‑age migrants
Shorter compulsory education
Between 2018 and 2021–2022, how did on‑site work prevalence change?
From about 30 percent to roughly 10 percent
From about 60 percent to nearly 90 percent
From about 50 percent to around 30 percent
From about 90 percent to around 60 percent
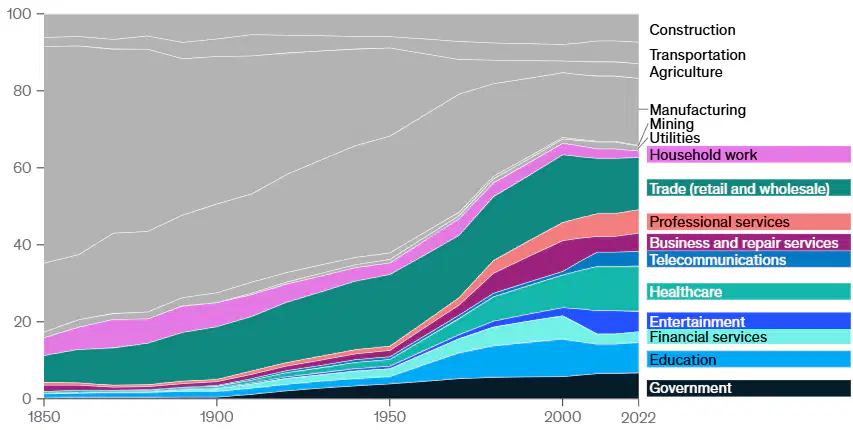
Which statement best summarizes the employment trajectory of agriculture in Europe and the US from 1850 to 2022?
Share remained constant across the period
Share declined significantly as services expanded
Share fluctuated cyclically without clear trend
Share rose steadily then stabilized after 2000
Why might increased productivity be particularly valuable when labor markets are tight?
It reduces competition for talent by shrinking demand
It guarantees immediate wage cuts to reduce costs
It boosts output without proportionally increasing headcount
It replaces the need for skills entirely
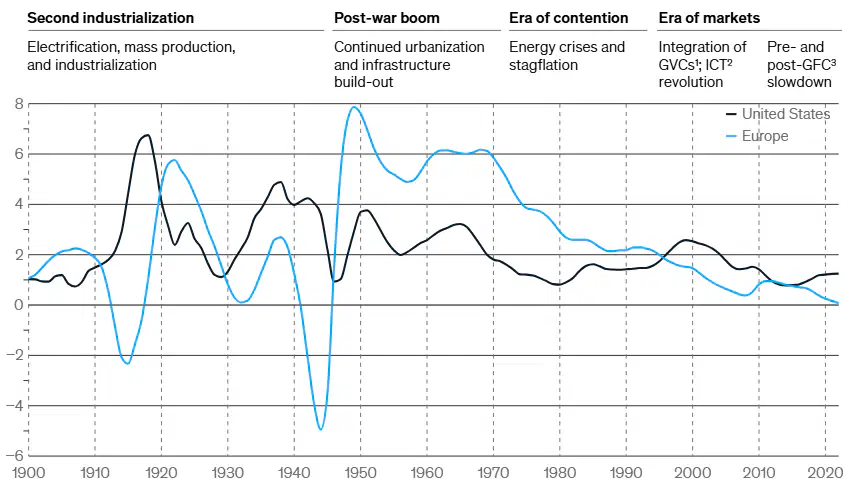
In the line chart titled “Labor productivity growth (annual change in GDP per hours worked), % year over year,” which region shows the larger spike in productivity growth during the immediate post‑war boom around the late 1940s to early 1950s?
United States shows the larger spike
Europe shows the larger spike
Both regions show identical spikes
Neither region shows any spike
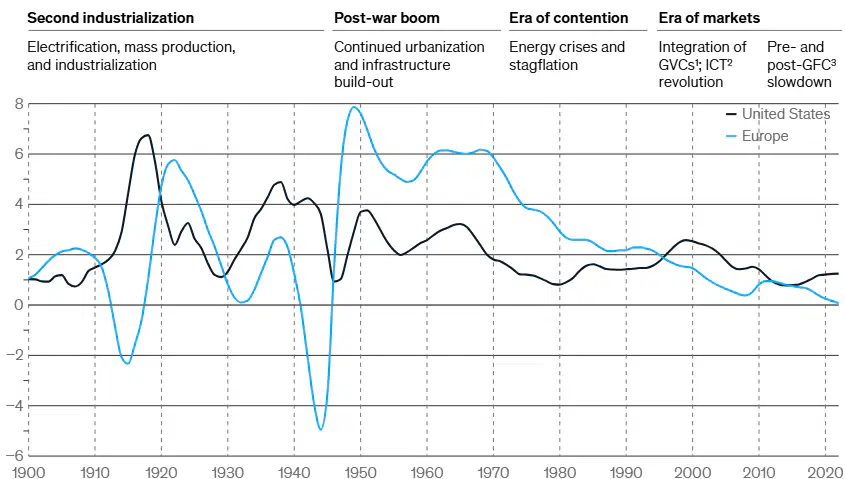
Which labeled era on the productivity chart corresponds with energy crises and stagflation?
Second industrialization era
Era of contention
Post‑war boom era
Era of markets
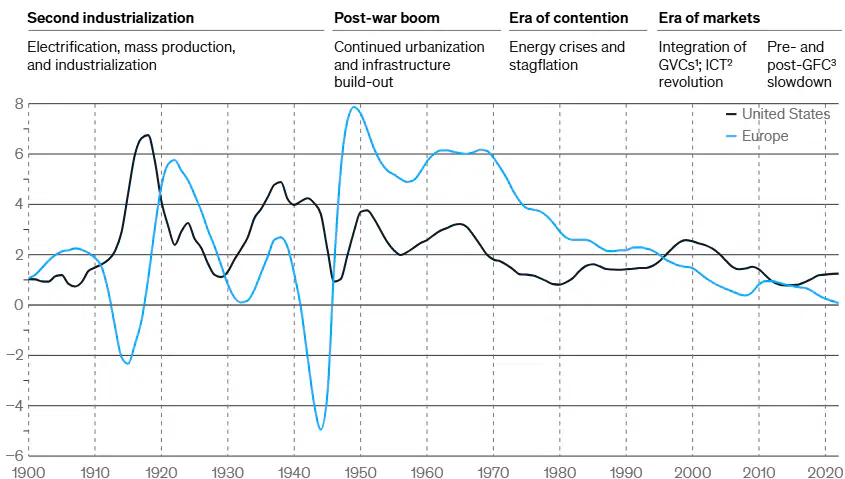
By 2022, how do the trend lines for U.S. and European productivity growth compare on the chart?
Both hover near zero growth
Europe exceeds U.S. by a lot
U.S. remains strongly positive
Europe turns sharply negative
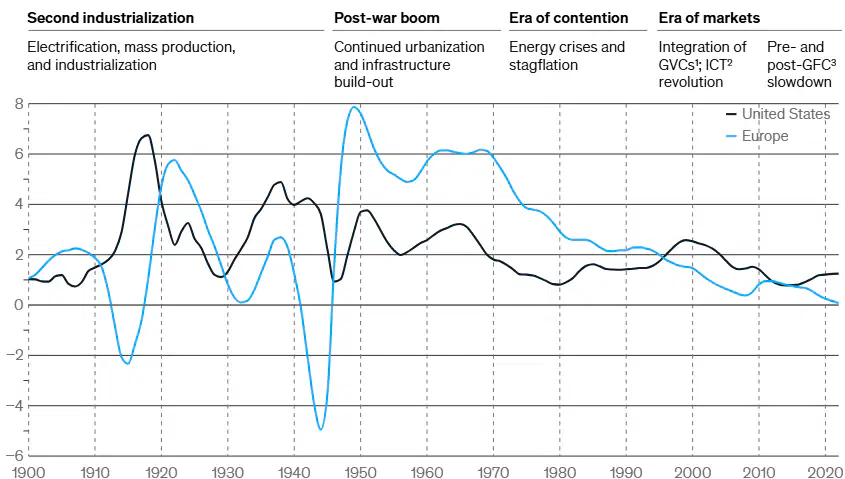
The exhibit headline states that European and US productivity growth decreased by how many percentage points between 1950 and 2022, respectively?
Nine and two percentage points
Five and five percentage points
Three and seven percentage points
Seven and three percentage points
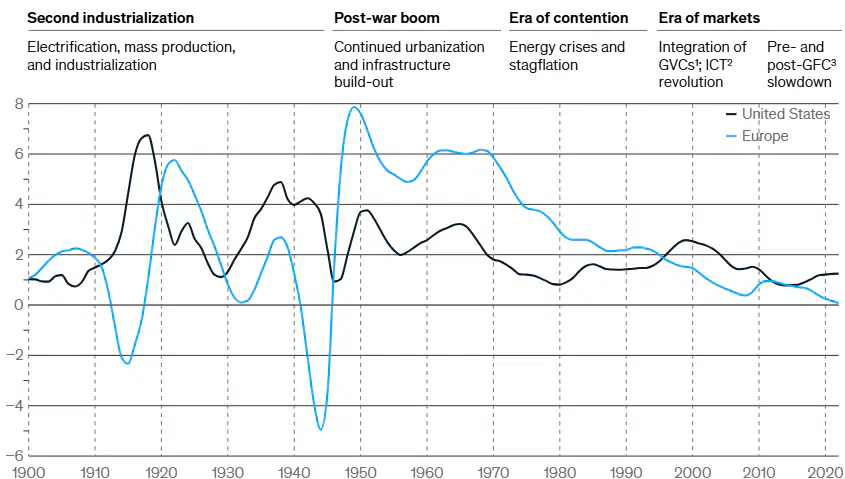
Which factors are cited beneath the chart as defining productivity and the countries used for European averages?
Productivity as GDP per hour worked
Purchasing‑power parity adjustment
Europe average of France, Germany, Italy, Spain, Sweden, United Kingdom
Including all 27 EU countries equally
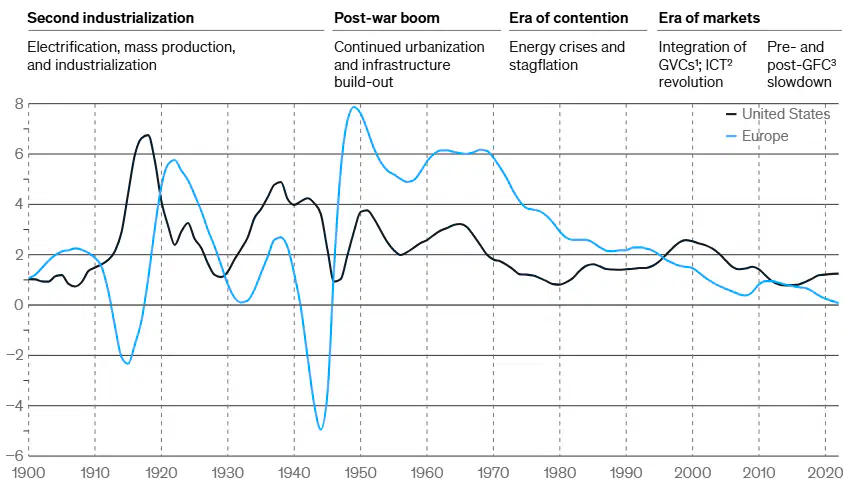
According to the paragraph below the chart, where are most AI‑related innovations developed today?
Primarily in Europe
Across both regions equally
In the United States
Mostly in emerging markets
What short‑term labor market signal did COVID‑19 create regarding occupational transitions between 2019 and 2022?
No measurable change in transitions
A permanent decline in mobility
A temporary surge indicating adaptability
A shift only in high‑skill roles
During 2019–2022, approximately what share of the US working population experienced occupational shifts, and how did this compare to historical averages?
5.5 percent; 1.5 times historical average
3.0 percent; triple historical average
2.0 percent; below historical average
7.0 percent; double historical average
Which sector is mentioned as still being affected even after transition rates returned to historical norms in Europe and the United States?
Financial services sector
Construction sector
Food service sector
Information technology sector
The large blue statement emphasizes decisions business leaders and policy makers must make. Which combination best captures these decisions?
How much to invest in new technologies
Whether to exit technology markets entirely
How much to embrace technological change
Whether to train and redeploy workers
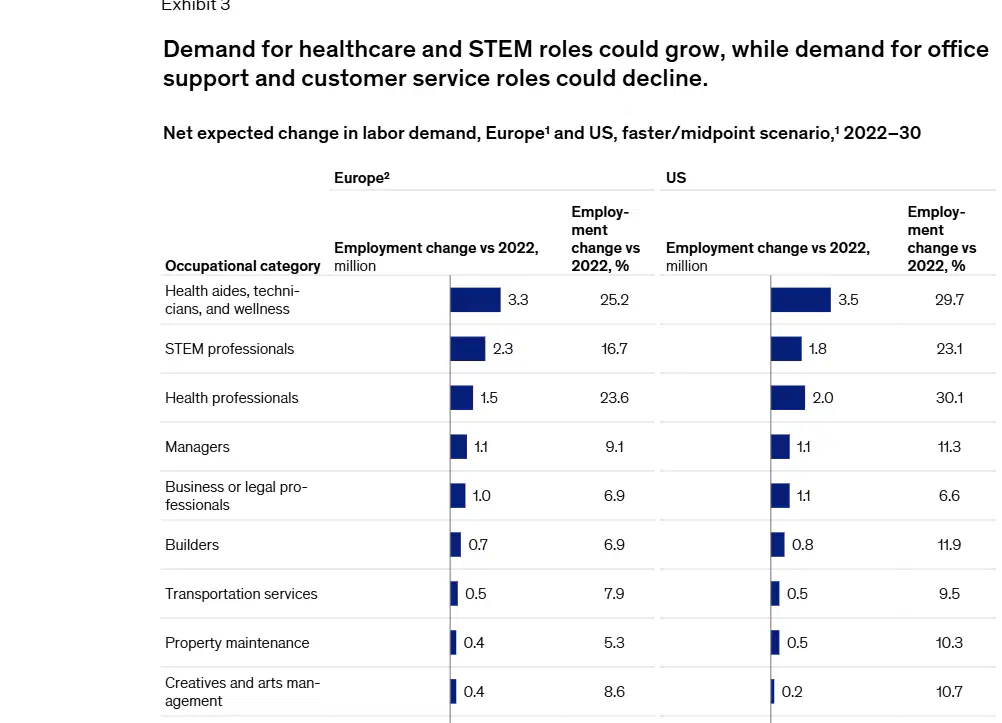
Which occupational category shows the largest expected decline in Europe by 2030 in the faster/midpoint adoption scenario?
Office support roles
Production work roles
Food services jobs
Customer service and sales
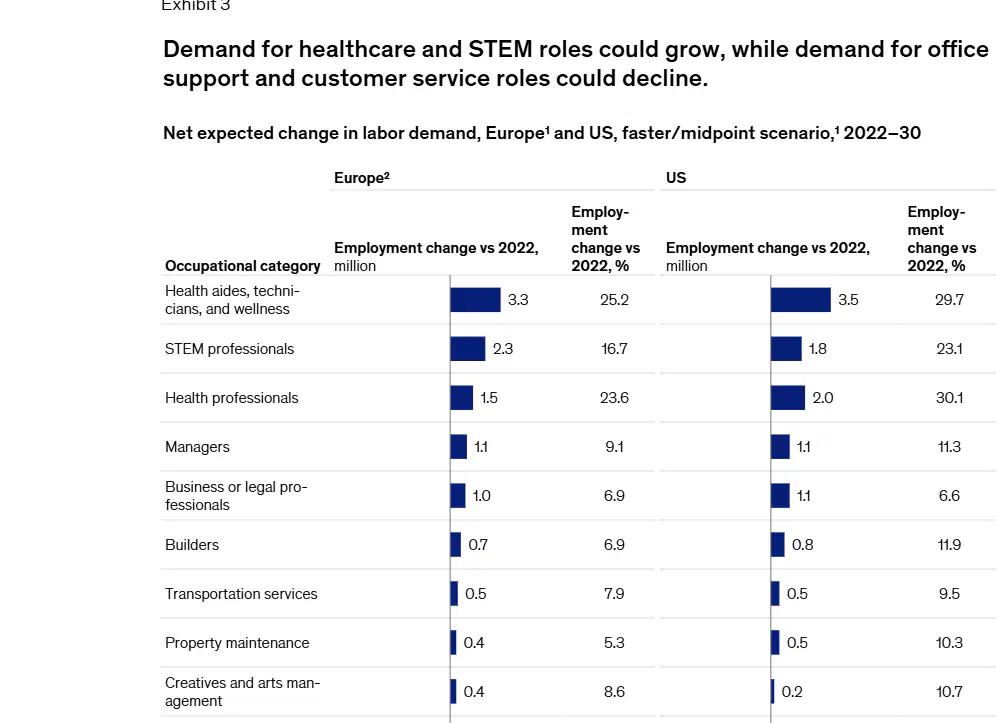
In the United States, which category is projected to add the most jobs by 2030 among the listed groups?
Health professionals
Managers
STEM professionals
Health aides, technicians, wellness

Which pair of categories are both projected to grow in employment in Europe by 2030?
Builders
Office support
STEM professionals
Food services
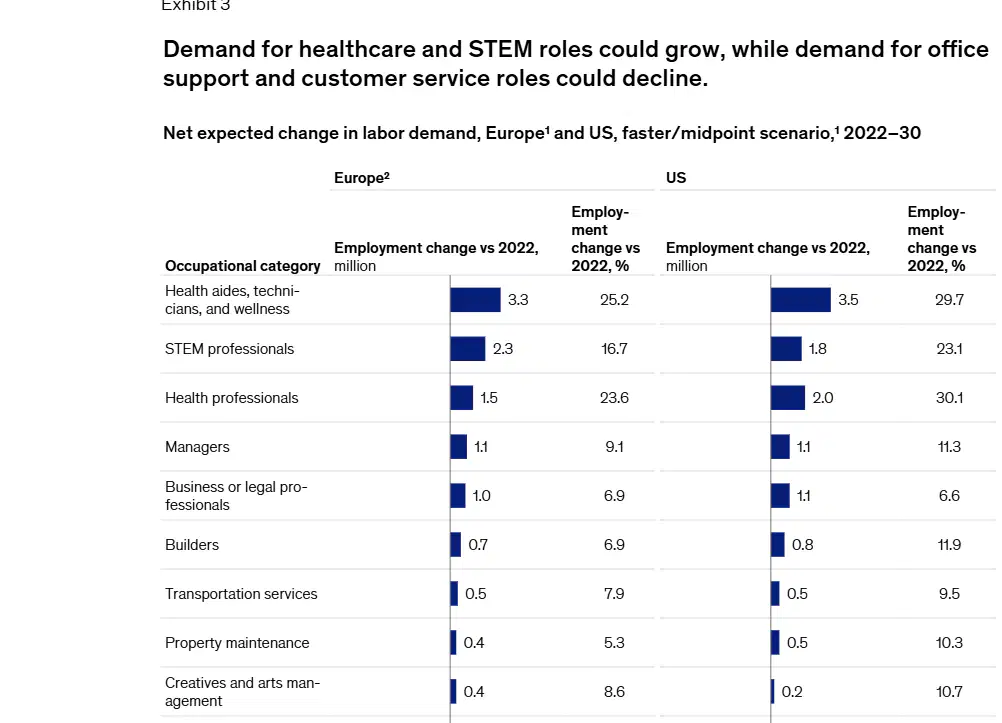
What is the approximate percent employment change for health professionals in the United States by 2030?
About 23 percent
About 30 percent
About 17 percent
About 11 percent
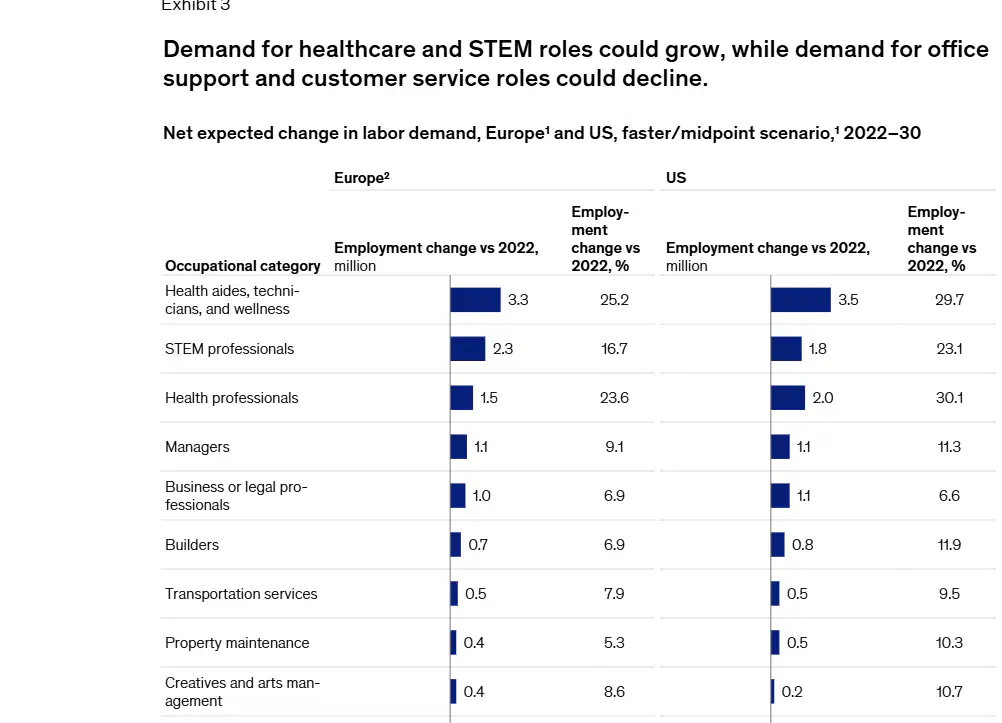
Which occupation group shows a negative change in both Europe and the United States?
Transportation services
Property maintenance
Production work
Community services
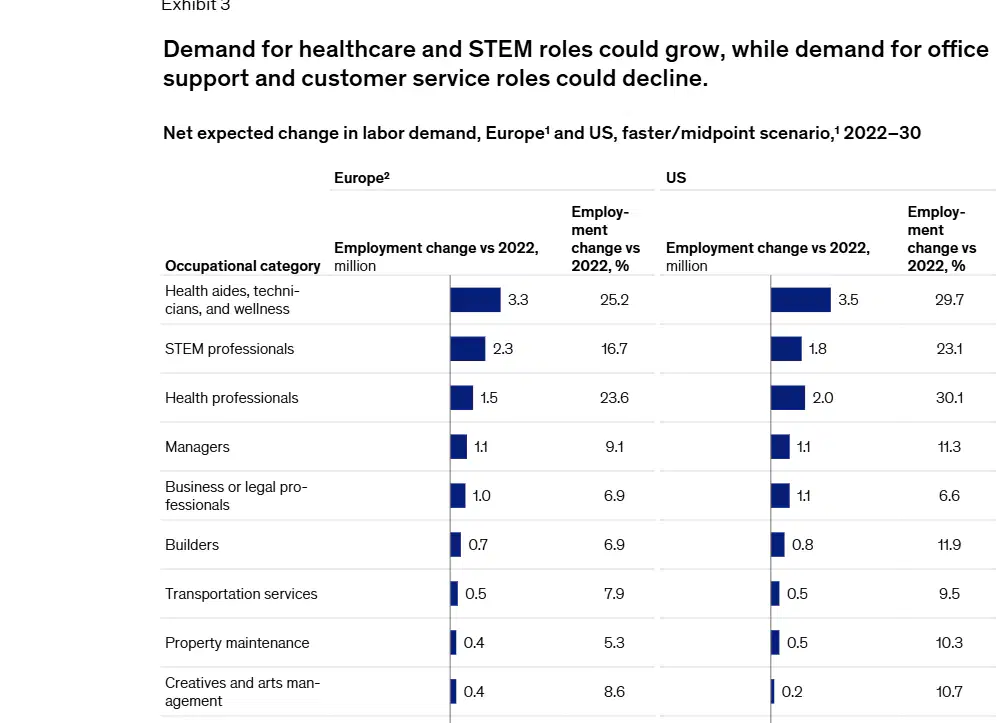
According to the projections, which statement best describes demand for healthcare and STEM roles by 2030?
Both remain roughly unchanged
Both are expected to grow strongly
STEM grows while healthcare declines
Healthcare grows while STEM declines

Which European category is closest to zero growth but still positive by 2030?
Mechanical installation and repair
Educator and workforce training
Community services
Transportation services
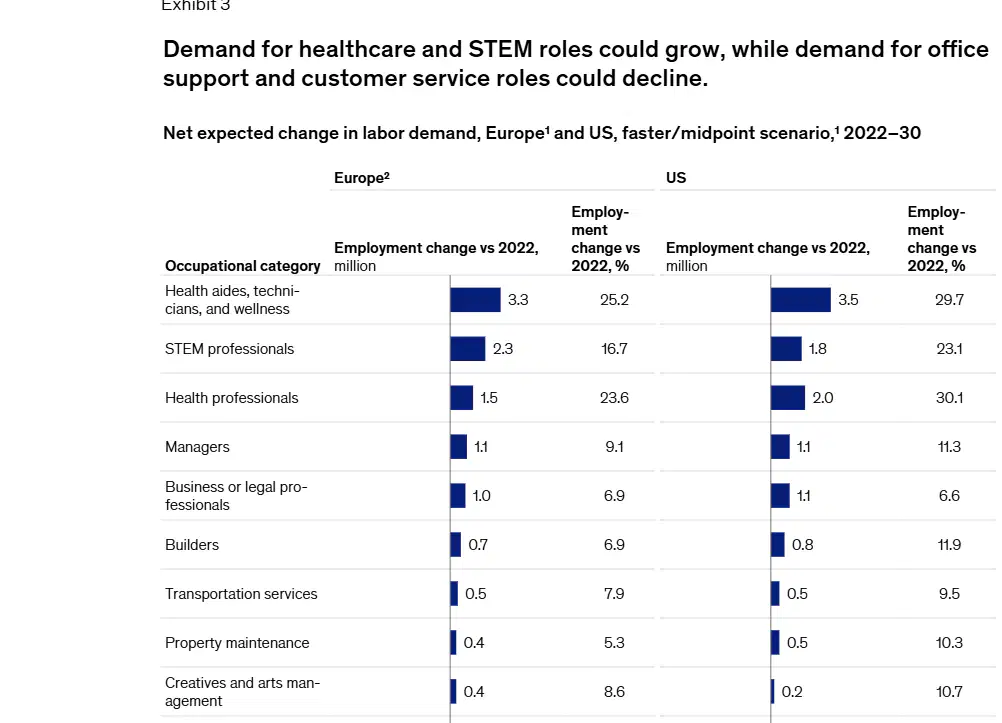
In Europe, which of the following has the largest negative percent change among declining categories?
Office support
Customer service and sales
Production work
Food services
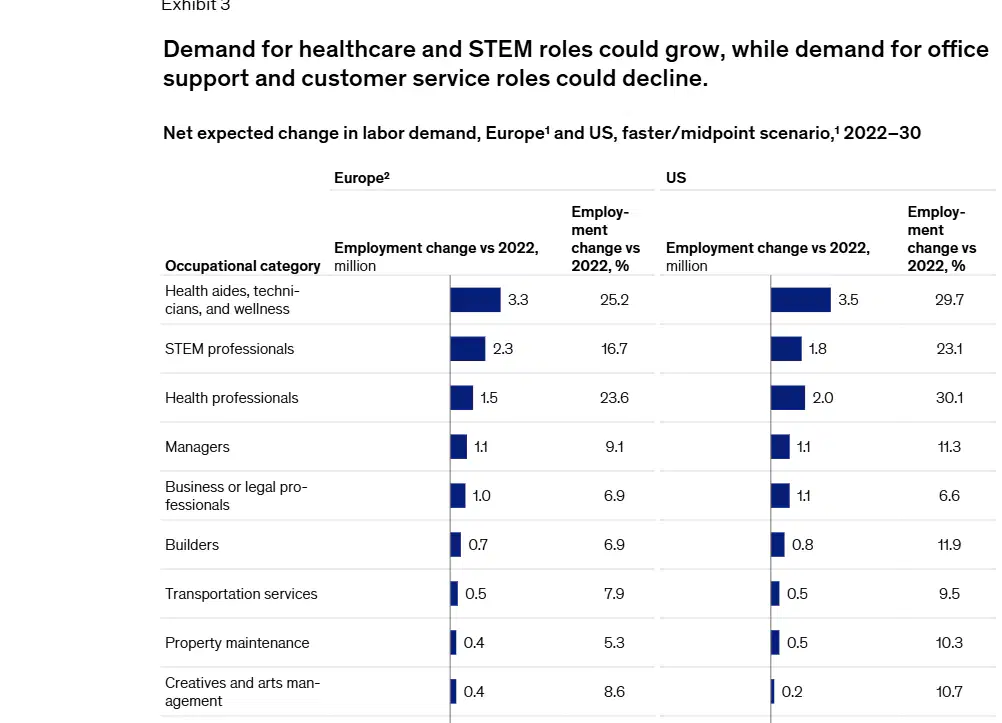
Which categories are projected to add roughly one million jobs in Europe by 2030?
Managers
Business or legal professionals
Builders
Transportation services
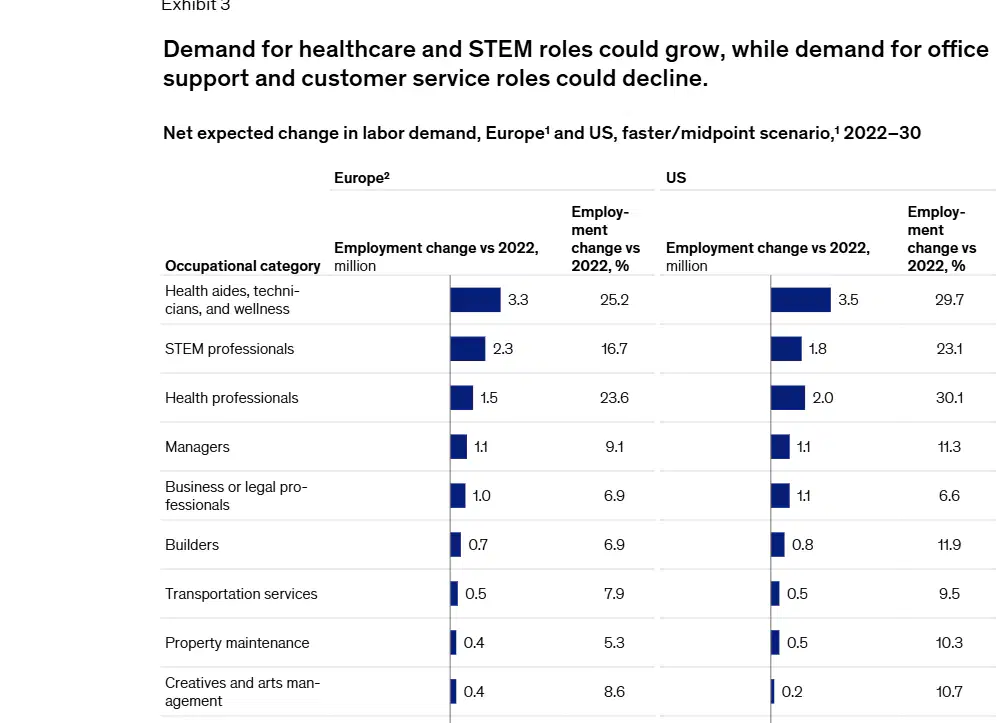
Which US category shows a small positive percent change near 2–3 percent by 2030?
Agriculture
Educator and workforce training
Business or legal professionals
Managers
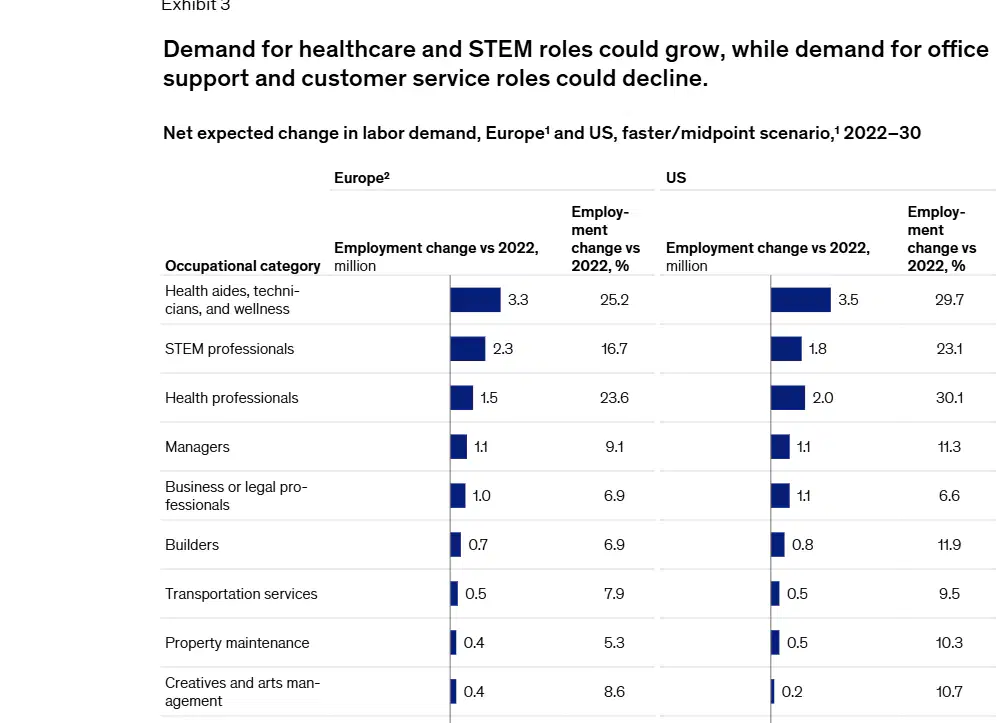
Which statement best captures the expected trend for office support and customer service roles through 2030?
Both decline in Europe and the US
Both grow in Europe and the US
Office support grows while customer service declines
Customer service grows while office support declines
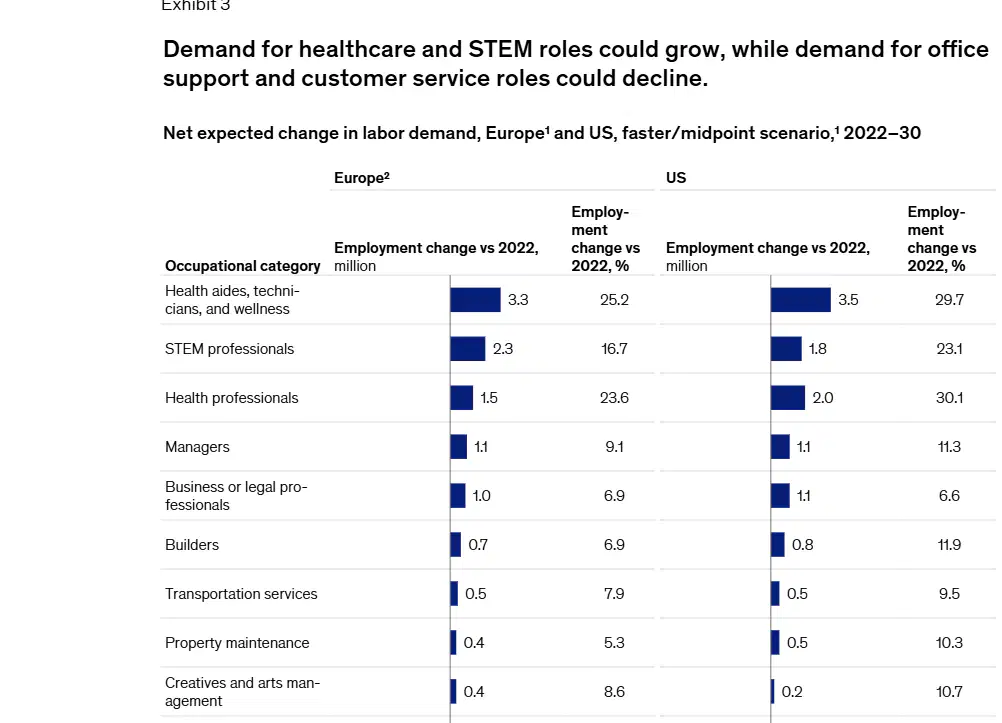
Which US category has growth around 10–12 percent by 2030?
Managers
Property maintenance
Creatives and arts management
Builders
By 2030, how many occupational transitions are projected in Europe under a faster automation adoption scenario?
About 8.5 million transitions
About 18.0 million transitions
About 12.0 million transitions
About 6.5 million transitions
Under the slower European scenario, what share of the current employed workforce would be affected by occupational transitions by 2030?
About 1.2 percent affected
About 4.6 percent affected
About 6.5 percent affected
About 7.5 percent affected
In the United States midpoint scenario, approximately how many occupational transitions are anticipated by 2030?
About 2.9 million transitions
About 8.6 million transitions
About 11.8 million transitions
About 5.6 million transitions
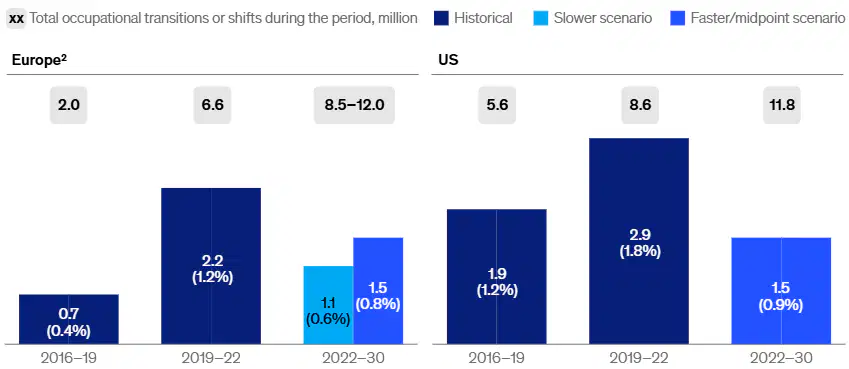
Which statement best contrasts Europe and the United States regarding the pace of occupational transitions between 2022 and 2030?
Neither region will reach historical pace due to labor shortages
US may require faster transitions, Europe may slow below historical pace
Europe may require faster transitions, US may return to historical pace
Both regions will exceed historical pace by the same margin
During 2016–19, approximately what share of the US workforce shifted occupations annually?
About 1.8 percent annually
About 1.2 percent annually
About 0.4 percent annually
About 0.9 percent annually
Which factor mainly explains why the United States could see a lower pace of occupational transitions in 2022–30 than in 2016–19?
High historical dynamism in job switching
Demographic aging of the workforce
Lower adoption of AI technologies
Stronger labor regulations in services
Which categories show highest transitions in Europe during 2022–30 according to the exhibit?
Office support
Customer service and sales
Food services
Mechanical installation and repair
Which categories show highest transitions in the US during 2022–30 according to the exhibit?
Customer service and sales
Office support
Business or legal professionals
Food services
How did occupational shifts during the 2019–22 pandemic period compare to pre-pandemic years in Europe and the United States?
They increased significantly in both regions
They increased only in Europe, not the US
They decreased significantly in both regions
They were unchanged from 2016–19
What do the pandemic-era shifts suggest about Europe and the United States?
Both will resist future occupational transitions
Only the US can adapt to automation disruptions
Both can adapt to future AI and automation disruptions
Only Europe can adapt to automation disruptions
With generative AI, what share of current work hours could be automated in Europe by 2030 under a midpoint adoption scenario?
About 30 percent of hours
About 27 percent of hours
About 20 percent of hours
About 45 percent of hours
With generative AI, what share of current work hours could be automated in the United States by 2030 under a midpoint adoption scenario?
About 48 percent of hours
About 21 percent of hours
About 27 percent of hours
About 30 percent of hours
Without generative AI, but with other automation, what are the approximate automation potentials by 2030?
45 percent in Europe and 48 percent in the US
12 percent in Europe and 18 percent in the US
27 percent in Europe and 30 percent in the US
20 percent in Europe and 21 percent in the US
By 2035, automation potential for hours worked is projected to reach which levels?
About 45 percent in Europe, 48 percent in US
About 20 percent in Europe, 21 percent in US
About 12 percent in Europe, 18 percent in US
About 27 percent in Europe, 30 percent in US
Which statement best describes the role of generative AI in automation trends?
It primarily reduces physical work without affecting services
It eliminates the need for any occupational transitions
It slows adoption due to integration barriers
It accelerates automation of complex cognitive tasks
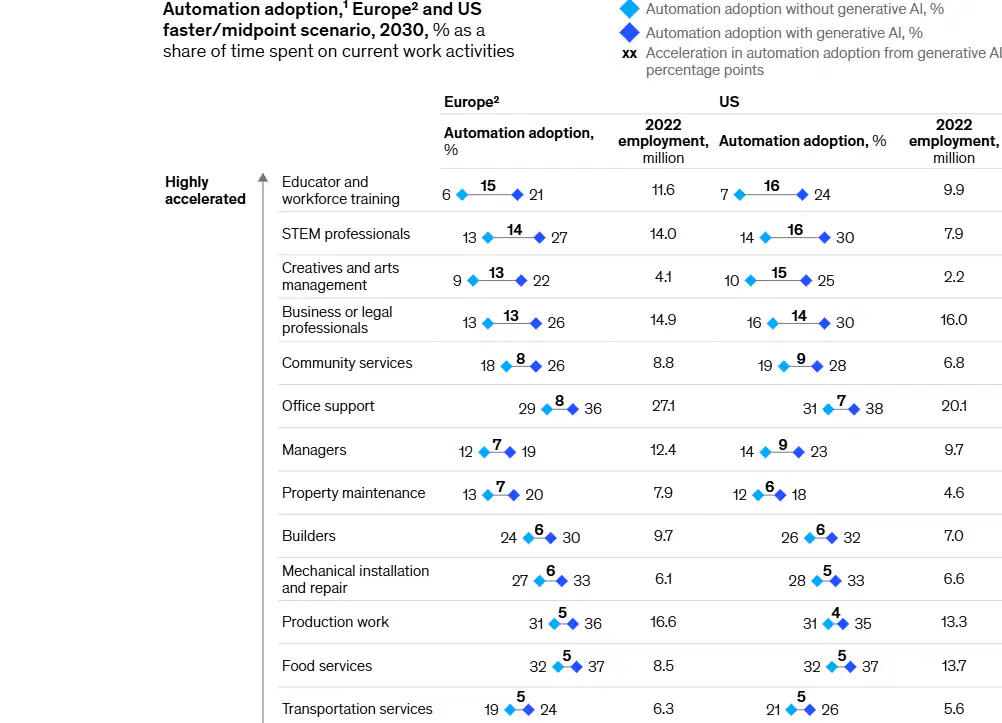
In the Europe panel of the exhibit, which occupation shows the largest acceleration in automation adoption with generative AI (difference between diamond and square markers)?
Managers show seven percentage points
Production work shows five percentage points
Office support shows eight percentage points
Educator and workforce training shows fifteen points
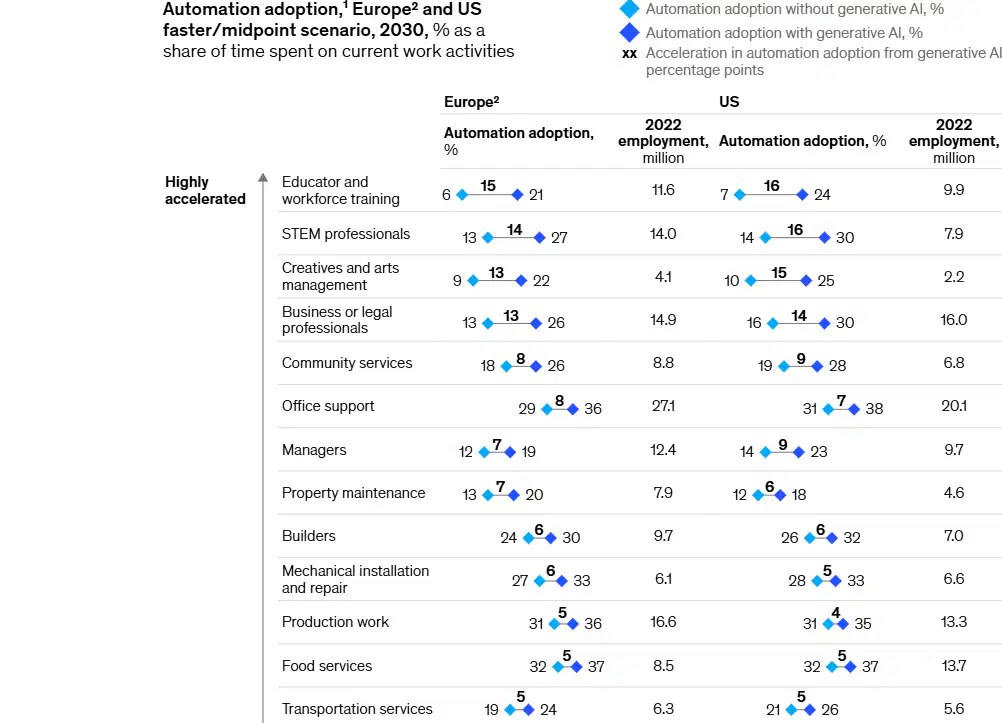
In the US panel, which occupation is categorized under highly accelerated adoption and shows automation adoption with generative AI at about 38 percent?
Transportation services at thirty‑eight percent
Food services at thirty‑eight percent
Production work at thirty‑eight percent
Office support at thirty‑eight percent
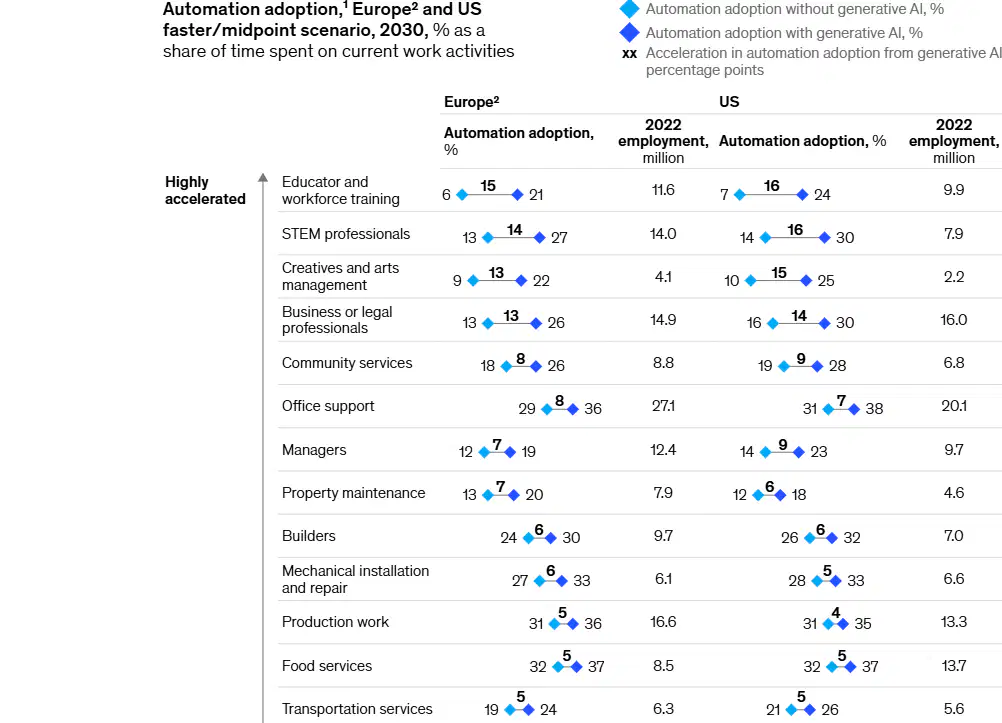
Which pair of occupations are both listed as highly accelerated in automation adoption across regions?
Health aides, technicians, and wellness
Business or legal professionals
STEM professionals
Agriculture
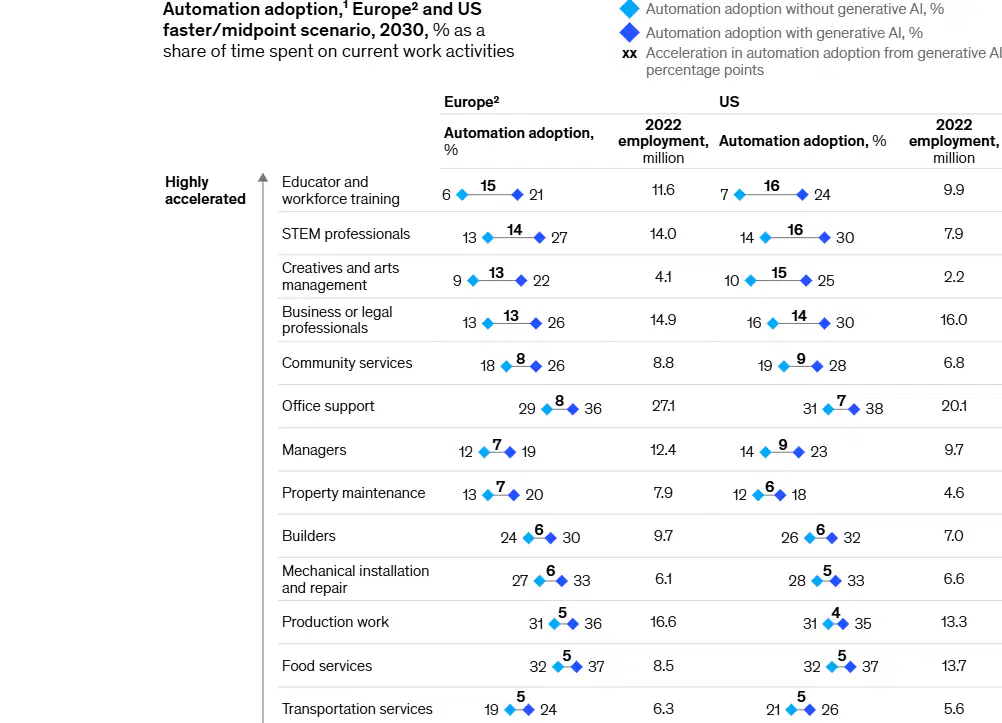
According to the Europe panel, which occupation has one of the lowest automation adoption levels without generative AI (square marker near 6 percent)?
Community services
Transportation services
Health professionals
Educator and workforce training

Comparing Europe and the US totals, what are the approximate automation adoption levels with generative AI across all occupational categories?
Europe thirty‑six percent; US thirty‑eight percent
Europe twenty‑one percent; US twenty‑four percent
Europe thirty percent; US twenty‑eight percent
Europe twenty‑eight percent; US thirty percent
Which statement best reflects how generative AI affects creative and arts management roles?
Automation share could fall due to originality needs
Automation share could rise from nine to twenty‑two percent
Automation share could rise from fifteen to thirty percent
Automation limited to routine tasks near five percent
What concept explains how technologies like AI can expand human labor rather than replace it?
Algorithmic displacement of expertise
Human redundancy in digital systems
Task substitution through mechanization
AI complementarity supports workers in tasks
Which occupations in Europe could more than double their automation share with generative AI integration, according to the text?
STEM professionals from thirteen to twenty‑seven percent
Managers from twelve to nineteen percent
Business and legal professionals from thirteen to twenty‑six percent
Educator and workforce training from six to twenty‑one percent
Which factor is identified as a potential barrier due to physical constraints on supply?
Consumer resistance to chatbot usage
Escalating wages from labor augmentation
Workforce shortages in integration teams
Energy supply limits for computing demand
What share of data centers’ electricity consumption is approximately dedicated to computing, as cited?
About eighty percent
About sixty percent
About twenty percent
About forty percent
Which combination illustrates demand‑side barriers to adoption discussed in the box?
Slower technical progress if adoption lags
Customer acceptance requiring behavioral changes
Shortages in computing power or energy resources
Integration into legacy systems taking longer
In the high‑case scenario from the International Energy Agency, how might data center electricity use change from 2022 to 2026?
Remain stable around 460 terawatt‑hours
Decrease from 1,000 to 460 terawatt‑hours
Increase from 460 to about 1,000 terawatt‑hours
Increase from 200 to about 500 terawatt‑hours
Which dynamic is most likely to both create jobs and trigger occupational transitions in Europe and the United States by 2030?
Net-zero actions with green investments
Declining spending on infrastructure
Stable fossil fuel production policies
Reduced focus on renewable energy
In the power sector, which shift is expected to add about a million gross jobs by 2030 across Europe and the United States?
Expansion of solar and wind power
Nuclear plant shutdowns
Greater oil refining capacity
Increased coal plant construction
Which pair best describes the offsetting effects of the net-zero transition on labor demand by 2030 in Europe?
Losses in carbon‑intensive sectors; gains in renewables
Losses in logistics; gains in in‑store retail
Gains in gas extraction; losses in EV manufacturing
Gains in coal mining; losses in construction
Which investments are highlighted as major drivers of job creation during the net‑zero transition?
Reducing spending on buildings
Retrofitting existing infrastructure
Expanding internal combustion engines
Building low‑emissions facilities
Which countries are noted as potentially facing larger occupational transitions due to high shares of coal and power generation jobs?
Norway and Denmark
Poland and Central‑Eastern Europe
France and Belgium
Spain and Portugal
What demographic trend is expected to significantly raise demand for healthcare services in advanced economies?
Growth of the elder population
Declining birth rates only
Rising youth unemployment
Urbanization of students
By 2030, approximately how large will the elder population be in the ten European focus countries, and what share of the population will this represent?
About 70 million; roughly 12 percent
About 120 million; roughly 25 percent
About 50 million; roughly 10 percent
About 94 million; roughly 18 percent
Which statement best captures projected healthcare spending growth between 2022 and 2030?
Faster annual growth in the United States
Faster annual growth in Europe
Equal annual growth in both regions
Negative real growth in both regions
How is continued expansion of e‑commerce expected to affect labor demand patterns?
Increase logistics jobs; reduce in‑store roles
Reduce logistics jobs; boost cashier roles
Increase in‑store roles; reduce warehousing
Unchanged mix across all retail jobs
Which country is cited as potentially leveraging wind resources to become a competitive producer of green hydrogen?
Spain
Germany
Italy
Sweden
Which statement best describes the overall scale of occupational transitions across European countries between 2022 and 2030?
Broadly similar across economies, with small differences
Highly divergent across economies, with massive gaps
Almost identical across all economies, with no variance
Unpredictable across economies, with no clear pattern
What primarily drives country-level differences in which occupations face transitions, despite similar overall scale?
Sectoral structure and occupational mix differences
Education policy changes and healthcare spending
Short-term business cycles and inflation rates
International migration flows and trade tariffs
Which scenario increases the share of transitions in a country’s workforce due to technical automation potential?
Higher prevalence of self-employed creative professions
Larger public sector with strong union protections
Lower adoption of digital tools and limited connectivity
Greater concentration of routine or advanced office tasks
Why might higher-wage countries experience more occupational transitions from automation?
High wages correlate with more stable industries
Workers demand fewer hours as wages increase
Automation becomes more attractive as wage costs rise
Training costs fall in high-wage environments
In Denmark, Germany, and Italy, why do office support roles account for a large share of transitions?
Strong decline in overall labor force participation
Rapid growth of agriculture and mining sectors
Lower-than-average adoption of AI technologies
High employment concentration in office support work
Which country is expected to have a relatively low share of transitions from office support roles due to small employment share in that category?
Italy
Sweden
Germany
Denmark
What explains the difference in office support transitions between Denmark and Poland?
Higher wages in Denmark increase incentives to automate
Stronger unions in Poland prevent process changes
More remote work in Poland reduces automation need
Denmark has fewer service firms than Poland overall
In which countries does production work make up a higher share of transitions, largely tied to carbon‑intensive industry exposure?
Czech Republic
United Kingdom
Netherlands
Poland
Which countries show a smaller share of transitions in production work, at about 9 percent and 8 percent respectively?
Germany and Italy
Czech Republic and Poland
Denmark and Sweden
Netherlands and United Kingdom
Why is agriculture expected to contribute an unusually large share of transitions in Poland by 2030?
Urbanization has eliminated regional farm labor demand
Farm subsidies are ending and exports are falling
Climate policy bans most agricultural machinery use
Agriculture’s employment share is high and less automated
Across many European countries other than Poland, what is the typical share of agriculture in total occupational transitions?
Around 15 percent to 20 percent range
Roughly 10 percent to 12 percent range
Between 1 percent and 4 percent range
Approximately 25 percent to 30 percent range
AI readiness helps explain country differences in labor market outcomes. Which elements commonly feed into an AI readiness index?
Digital infrastructure
Agricultural land area and water resources
Human capital and labor market policies
Regulation and innovation capacity
Which countries are highlighted as high scorers on AI readiness among the ten European countries studied?
Netherlands and Sweden
Italy and Spain
Poland and the Czech Republic
Germany and the United Kingdom
Which occupational category has the highest share of expected transitions in Germany between 2022 and 2030 in the faster/midpoint scenario?
Customer service and sales
Food services
Production work
Office support
In the United States, which category accounts for the largest share of expected transitions in the faster/midpoint scenario?
Food services
Production work
Customer service and sales
Office support
Which pair of countries shows a 50% or higher share of transitions in Office support?
Poland and Spain
Italy and Denmark
Germany and Italy
United Kingdom and Sweden
Which country has the highest share of transitions in Production work among the listed countries?
Czech Republic
Germany
Poland
Italy
In France, which category has a higher share of transitions than in the Netherlands?
Office support
Customer service and sales
Food services
Production work
Which occupational categories generally show very low transition shares (0–1%) across most countries?
Creatives and arts management
Managers
STEM professionals
Health professionals
Which statement best describes the overall pattern in the heatmap?
STEM professionals exceed 5% in several countries
Office support dominates transitions across countries
Food services consistently has the highest shares
Managers are above 10% in most countries
Which country shows the largest total occupational transitions as a percent of 2022 employment?
Germany at 7.0%
Poland at 6.1%
Italy at 7.4%
United States at 7.5%
Compare Customer service and sales between Spain and Sweden. Which is true?
Both are under 10%
Spain is lower than Sweden
Spain equals Sweden
Spain is higher than Sweden
Which categories cluster around 5–7% in several countries, indicating mid-range transition shares?
Business or legal professionals
Mechanical installation and repair
Educator and workforce training
Food services
Which statement best captures the overarching message about workforce skills by 2030?
Basic cognitive and physical skills will dominate
Only manual craftsmanship will significantly expand
Technological and social emotional skills will rise
Higher cognitive skills will replace all other groups
In this chapter’s framework, workforce skills are grouped into five categories. Which set lists them correctly?
Physical and manual; basic cognitive; higher cognitive; social and emotional; technological
Physical and manual; administrative; managerial; interpersonal; digital
Technical trades; office tasks; leadership; customer service; analytics
STEM; humanities; arts; business; services
What is the primary reason cited for changing skill demand across jobs?
Global trade tariffs and reshoring
Education policy reforms worldwide
Population aging and urban migration
Automation and integration of AI into work
By 2030, where is demand for technological skills projected to see substantial growth in hours worked?
Sub-Saharan Africa
Latin America
United States
Europe
Which roles mainly drive the rising need for social and emotional skills?
Back-office data entry duties
Autonomous vehicle dispatching
Assembly line machine tending
Jobs requiring empathy and leadership
Which skill group is expected to experience the largest decline in demand for hours worked?
Basic cognitive skills
Technological skills
Social and emotional skills
Higher cognitive skills
Select the best explanation for the projected decline in some higher cognitive skills such as advanced literacy and writing.
Automation can perform tasks needing these abilities
Workers are losing interest in these careers
Regulations restrict the use of such skills
Universities are reducing related programs
Physical and manual skills account for a large share of labor today. What is their projected change in Europe by 2030?
Sharp decline of more than fifteen percent
No change across the decade
Steady growth of over twenty percent
Slight decline of about one percent
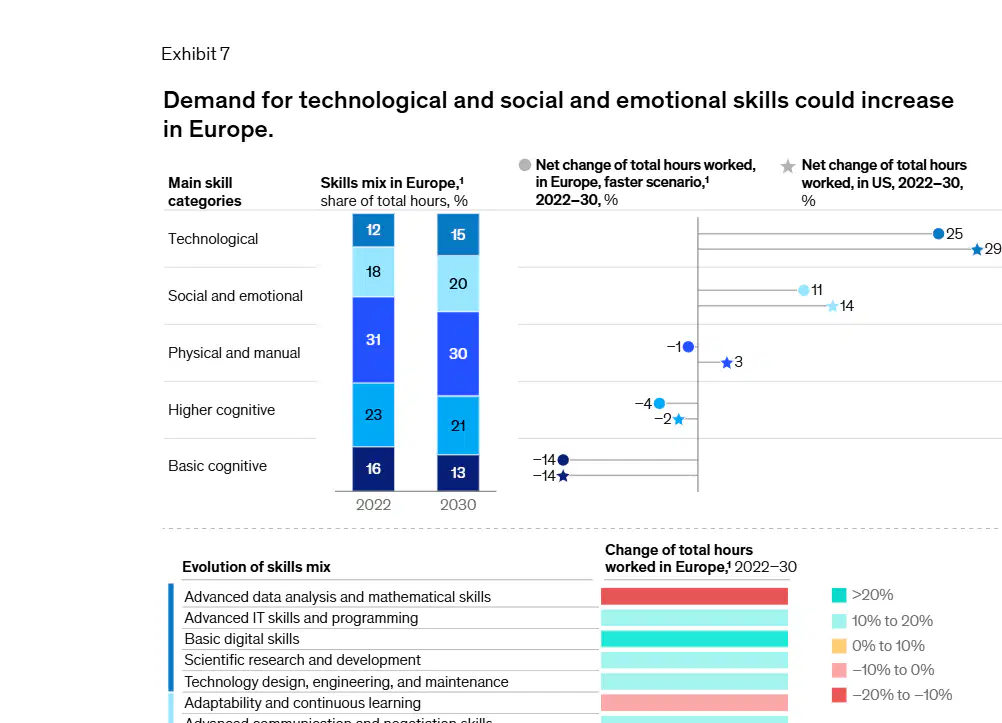
Which combination accurately pairs a main skill category with an example from the evolution list?
Higher cognitive — gross motor skills and strength
Social and emotional — quantitative and statistical skills
Basic cognitive — empathy and people leadership
Technological — advanced IT skills and programming
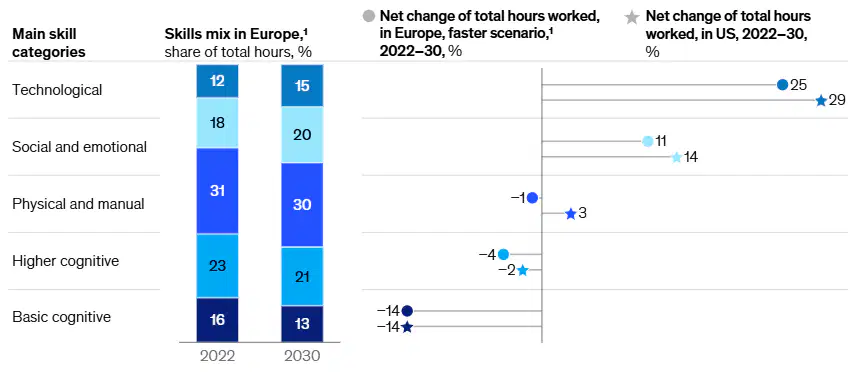
According to the Europe chart, how does the skills mix share change for technological and basic cognitive categories from 2022 to 2030?
Both technological and basic cognitive shares rise
Technological share falls; basic cognitive share rises
Technological share rises; basic cognitive share falls
Both technological and basic cognitive shares stay flat
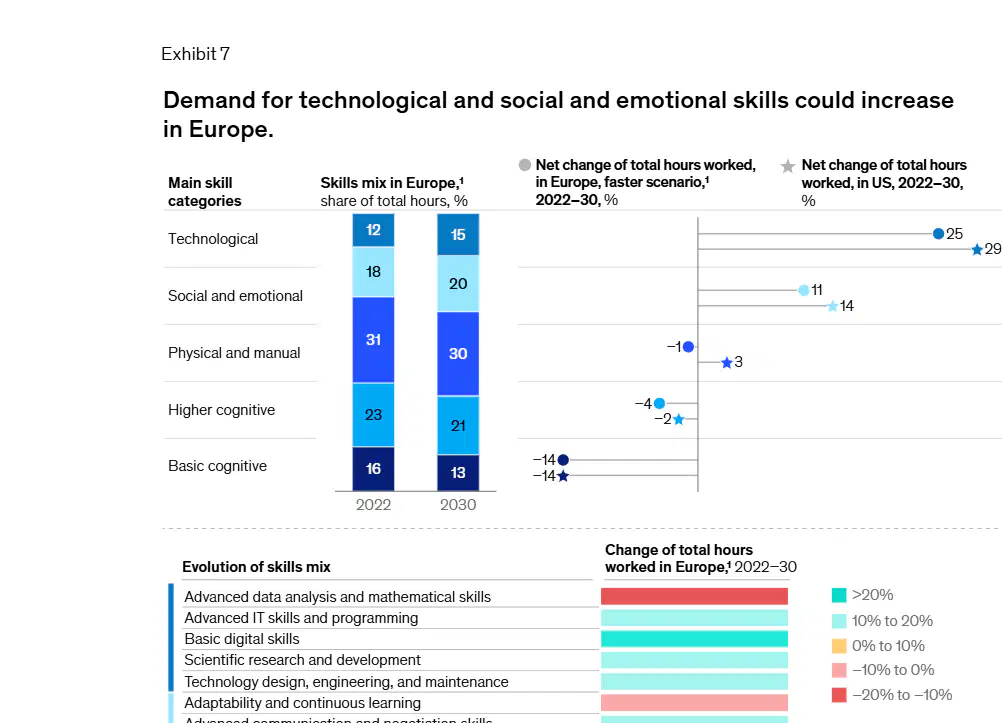
Which selected skills are projected to grow more than 20 percent in Europe between 2022 and 2030?
Creativity
Advanced IT skills and programming
Advanced data analysis and mathematical skills
Project management

Which of the following skills are shown as declining by −20% to −10% in Europe?
Basic data input and processing
Advanced literacy and writing
Basic literacy, numeracy, and communication
Inspecting and monitoring
What is a key implication for companies in light of shifting skill demands?
Retraining staff and finding new strategies
Halting recruitment to control costs
Outsourcing all technology work abroad
Relying solely on current capabilities
Why might quantitative and statistical skills see lower demand in Europe by 2030?
These skills lack relevance in any industry
Global wage convergence reduces incentives
Fewer students study mathematics today
Automation may perform activities requiring them
Which pairing aligns a skill with the social and emotional category?
Complex information processing and interpretation
Interpersonal skills and empathy
Advanced data analysis and modeling
Fine motor skills and dexterity

