
Resource Type


Subjects
11th Grade Probability and Statistics Presentations
This Grade 11 Probability and Statistics presentation explains essential concepts through structured lesson slides and visual learning materials. Students will explore statistical analysis, probability distributions, and data interpretation using clear instructional content designed for comprehensive understanding.
Recommended topics for you

16 questions
Tree Diagrams and Conditional Probability

Presentation
•
9th - 12th Grade
29 questions
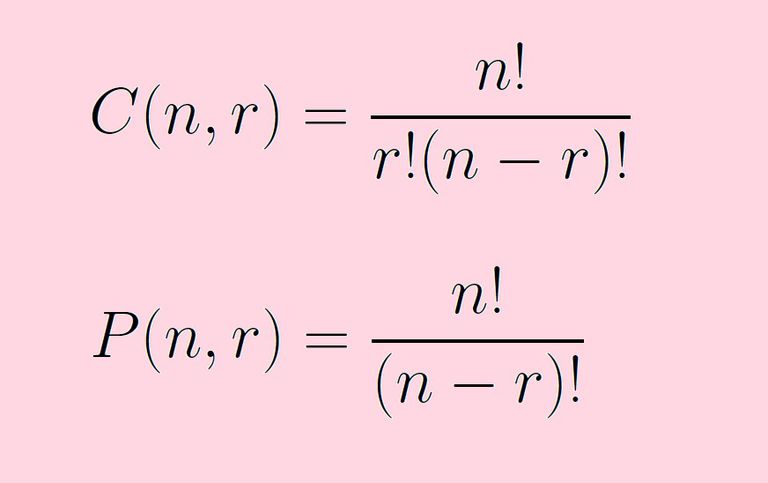
Permutations and Combinations
Presentation
•
11th - 12th Grade

19 questions
Interpreting Confidence Intervals
Presentation
•
10th Grade - University

10 questions
Median for Grouped Data
Presentation
•
11th - 12th Grade
42 questions
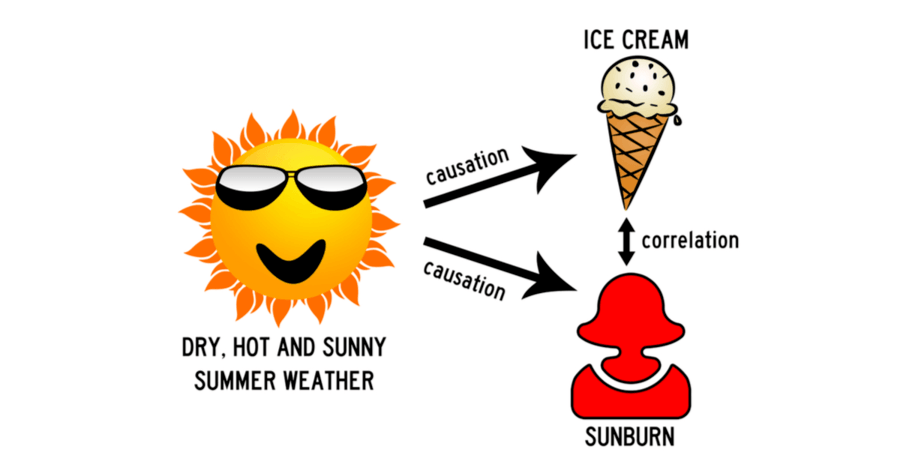
Correlation vs Causation
Presentation
•
7th - 12th Grade

52 questions
Tree Diagrams - Conditional Probabilities
Presentation
•
9th - 12th Grade
17 questions
Lesson on Permutation and Combination
Presentation
•
11th - 12th Grade
25 questions
Z-Score
Presentation
•
9th - 12th Grade
25 questions
Probability of Dependent and Independent Events
Presentation
•
9th - 12th Grade
28 questions
HPC Section 2.8 Curves of best fit.
Presentation
•
9th - 12th Grade
20 questions
Measures of Center A1
Presentation
•
8th - 12th Grade
43 questions
2.2 Normal distributions
Presentation
•
11th - 12th Grade
Explore 11th Grade Probability and Statistics Presentations
Probability and Statistics presentations for Grade 11 students provide comprehensive concept explanation and visual learning opportunities that build essential mathematical reasoning skills. These structured instructional resources guide students through fundamental concepts including probability distributions, statistical measures, hypothesis testing, and data analysis techniques. The presentations emphasize visual learning through clear diagrams, step-by-step problem solving demonstrations, and real-world applications that help students understand how statistical concepts apply to everyday situations. Students develop critical thinking abilities as they learn to interpret data, calculate probabilities, make predictions based on statistical evidence, and understand the relationship between theoretical and experimental probability outcomes. Wayground supports mathematics educators with access to millions of teacher-created presentation resources specifically designed for Grade 11 Probability and Statistics instruction. The platform's robust search and filtering capabilities enable teachers to quickly locate presentations aligned with specific curriculum standards and learning objectives, while differentiation tools allow for customization based on individual student needs and learning styles. These digital-first presentations can be seamlessly integrated into classroom instruction, homework assignments, or independent study sessions, providing flexible delivery options that accommodate diverse teaching environments. Teachers utilize these comprehensive presentation collections for lesson planning, concept introduction, skill reinforcement, and targeted remediation, ensuring students receive structured instruction that builds confidence in statistical reasoning and probability calculations essential for advanced mathematics coursework.

Accessibility
Features
Wayground Super
School & District
Wayground for Business
Create a quiz
Create a presentation
Wayground AI
Subjects
Mathematics
Social Studies
Science
Physics
Chemistry
Biology
About
Our Story
Wayground Blog
Media Kit
Careers
Support
F.A.Q.
Help & Support
Privacy Policy
Terms of Service
Teacher Resources
2026 Wayground


Get our app

