Statistics and probability
Analyzing categorical data videos
Explore categorical data analysis by interpreting frequency tables and bar charts, enhancing data literacy and critical thinking skills through engaging visual comparisons and data-driven decision-making.
200+ videos and assessments
Standards aligned
Vetted by experts
Analyzing one categorical variable
VIDEOS
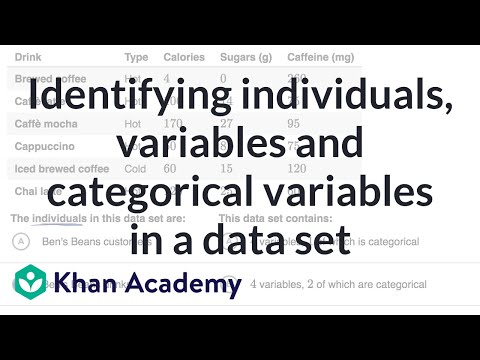
Identifying individuals, variables and categorical variables in a data set
Khan Academy
•7th - 10th Grade
•10 Qs
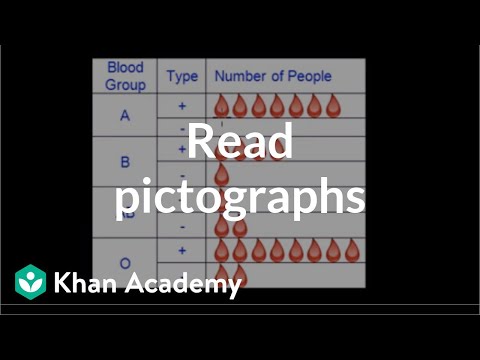
Reading pictographs
Khan Academy
•5th - 8th Grade
•7 Qs
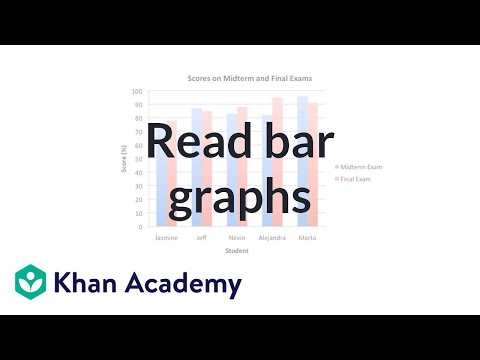
Reading bar graphs
Khan Academy
•5th - 8th Grade
•10 Qs
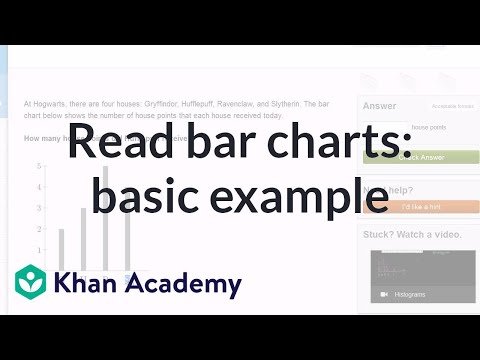
Reading bar graphs: Harry Potter
Khan Academy
•3th - 5th Grade
•5 Qs
Creating a bar graph
Khan Academy
•4th - 8th Grade
•7 Qs

Reading bar charts: comparing two sets of data
Khan Academy
•5th - 8th Grade
•8 Qs
Reading bar charts: putting it together with central tendency
Khan Academy
•6th - 10th Grade
•10 Qs
Reading pie graphs (circle graphs)
Khan Academy
•6th - 10th Grade
•10 Qs
Two-way tables
VIDEOS

Two-way frequency tables and Venn diagrams
Khan Academy
•6th - 10th Grade
•10 Qs
Two-way relative frequency tables
Khan Academy
•6th - 10th Grade
•10 Qs
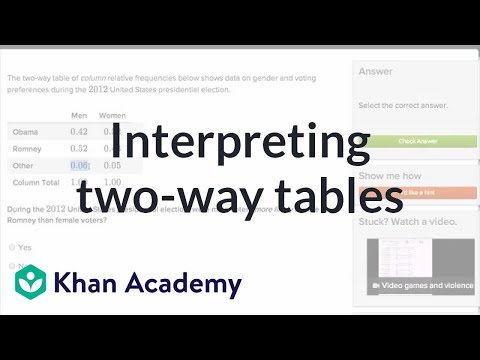
Interpreting two-way tables
Khan Academy
•8th - 12th Grade
•9 Qs

Categorical data example
Khan Academy
•6th - 8th Grade
•10 Qs
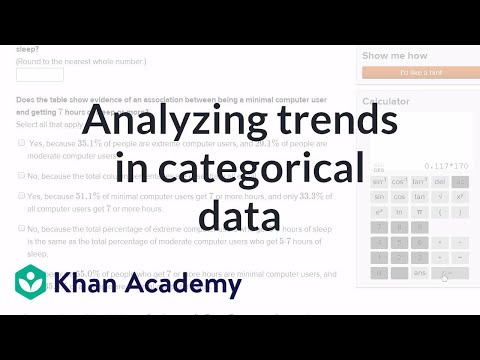
Analyzing trends in categorical data
Khan Academy
•9th - 12th Grade
•10 Qs

Start adapting your curriculum in minutes.
The best way to create, adapt, and deliver resources differentiated for every student.
