Statistics and probability
Displaying and comparing quantitative data videos
Learn to display and compare quantitative data using charts, graphs, and statistical measures, developing skills to interpret data patterns and differences accurately.
200+ videos and assessments
Standards aligned
Vetted by experts
Displaying quantitative data with graphs
VIDEOS
Representing data
Khan Academy
•5th - 10th Grade
•10 Qs
Frequency tables & dot plots
Khan Academy
•4th - 4th Grade
•11 Qs

Creating a histogram
Khan Academy
•6th - 6th Grade
•10 Qs
Histograms
Khan Academy
•6th - 10th Grade
•10 Qs
Interpreting a histogram
Khan Academy
•6th - 10th Grade
•10 Qs

Stem-and-leaf plots
Khan Academy
•1th - 5th Grade
•10 Qs

Reading stem and leaf plots
Khan Academy
•1th - 5th Grade
•10 Qs
Describing and comparing distributions
VIDEOS
Shapes of distributions
Khan Academy
•9th - 12th Grade
•10 Qs
Clusters, gaps, peaks & outliers
Khan Academy
•6th - 8th Grade
•10 Qs
Comparing distributions with dot plots (example problem)
Khan Academy
•7th - 10th Grade
•10 Qs
Comparing dot plots, histograms, and box plots
Khan Academy
•6th - 6th Grade
•9 Qs
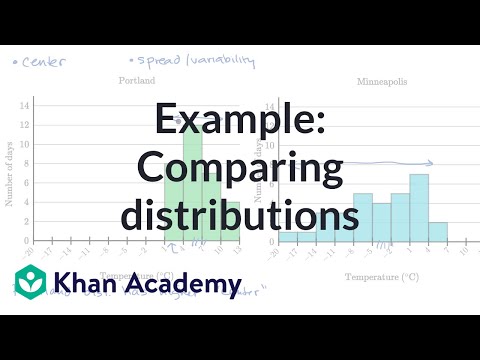
Example: Comparing distributions
Khan Academy
•9th - 12th Grade
•10 Qs

Start adapting your curriculum in minutes.
The best way to create, adapt, and deliver resources differentiated for every student.
