
interpreting graphs of proportional relationships
Presentation
•
Mathematics
•
7th Grade
•
Practice Problem
•
Medium
+4
Standards-aligned

JUSTIN COTTON
Used 35+ times
FREE Resource
5 Slides • 16 Questions
1
interpreting the graphs of proportional relationships

2
Multiple Choice

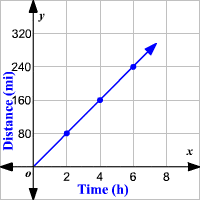
What are the coordinates represented in the graph above?
3
The constant of proportionality in this graph would be 12/16 or 3/4 or 0.75. We find the constant of proportionality by dividing the dependent value by the independent value.

4
Open Ended

Tyler was at the amusement park. He walked at a steady pace from the ticket booth to the bumper cars.
The point on the graph shows his arrival at the bumper cars. What do the coordinates of the point tell us about the situation?
5
Tyler was at the amusement park. He walked at a steady pace from the ticket booth to the bumper cars.
The point on the graph shows his arrival at the bumper cars. What do the coordinates of the point tell us about the situation?
The point tells us that it took him 40 seconds to get 50 meters away from the ticket booth.

6
Fill in the Blanks

Type answer...
7
Open Ended

What does the point (0,0) tell you about the situation?
8
Multiple Choice

How far away from the ticket booth was Tyler after 1 second?
9
10
Open Ended

What is the constant of proportionality for the relationship between time and distance? What does this tell you about Tyler's walk?
11
Open Ended

To the see the image, click it to see it clearer.
What do the points (12, 5) tell you about the water in the bucket?
12
13
Multiple Choice

14
Multiple Choice

15
Multiple Choice

16
Multiple Choice

17
Multiple Choice
18
Multiple Choice
19
Multiple Choice

20
Multiple Choice
What is the unit rate?
21
Multiple Choice

interpreting the graphs of proportional relationships
Show answer
Auto Play
Slide 1 / 21
SLIDE
