
Unit 9 Review
Presentation
•
Mathematics
•
12th Grade
•
Medium
+3
Standards-aligned

Charlotte Turrubiartes
Used 2+ times
FREE Resource
6 Slides • 31 Questions
1
Unit 9 Review

2
Multiple Choice

How many people liked Bugs Bunny the best?
3
Multiple Choice
Did more people like Bugs Bunny or Tweety?
4
Multiple Choice
Which character did exactly 2 people say was
their favorite?
5
Multiple Choice
Which character did the largest number of people say was their favorite?
6
Multiple Choice
How many total people were included in the survey?
7
Multiple Choice

Here are the scores to a recent test. Find the mean.
8
Multiple Choice
Here are the scores to a recent test. Find the median.
9
Multiple Choice
Here are the scores to a recent test. Find the standard deviation.
10
Multiple Choice
Here are the scores to a recent test. Find the IQR.
11
Multiple Choice
Here are the scores to a recent test. Find the range.
12
Multiple Choice

The number of team wristbands sold in two stores is shown in the boxplot. Which store has the higher median sold?
13
Multiple Choice
The number of team wristbands sold in two stores is shown in the boxplot. Which store has the larger range?
14
Multiple Choice
The number of team wristbands sold in two stores is shown in the boxplot. Which store has the larger interquartile range?
15
Fill in the Blanks

Type answer...
16
Fill in the Blanks
Type answer...
17
Fill in the Blanks
Type answer...
18
Fill in the Blanks
Type answer...
19
Fill in the Blanks
Type answer...
20
Multiple Select
Determine if there are any maximum or minimum outliers. Show work!
21

22
Multiple Choice
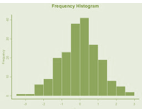
Describe the shape of the graph.
23
Multiple Choice

Which of the following best describes the shape of the distribution?
24
Multiple Choice

Shape?
25
Multiple Choice

What is the shape of this bar graph?
26
Fill in the Blanks

Type answer...
27
Fill in the Blanks

Type answer...
28
Fill in the Blanks

Type answer...
29
Multiple Choice

Which student did better on the test relative to the class?
30
Fill in the Blanks

Type answer...
31

32
Fill in the Blanks

Type answer...
33

34
Multiple Choice

What height puts in in the 75th percentile?
35

36
Multiple Choice

What height puts a man in the top 10%?
37

Unit 9 Review
Show answer
Auto Play
Slide 1 / 37
SLIDE
