
Slope of a Line
Presentation
•
Mathematics
•
9th Grade
•
Practice Problem
•
Medium
Standards-aligned

Susan Joyce
Used 34+ times
FREE Resource
10 Slides • 17 Questions
1
Slope of a Line

2
Slope
Slope measures the steepness of a line
Known as rate of change
Known as rise over run
Know as change in y over change in x
Slope is represented by the variable "m"

3
Finding the Slope from Two Points
Slope formula: (y2- y1 ) / (x 2 - x1 )
Each point in the coordinate plane can be represented as an ordered pair (x, y)
Label each set of points as (x , y ) and (x , y ).
To find the slope, subtract the y-values and divide by the difference of the x-values

4
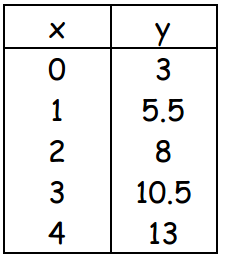
Slope from Two Points in a Table
Subtract y-values = numerator
Subtract corresponding x-values = denominator
Always reduce slope (simplifying the fraction)

5
Multiple Choice

6
Multiple Choice
7
Multiple Choice

8
Multiple Choice

9
Slope from Two Points on a Graph
Locate two points on the line and determine the coordinates of each point (x, y)
Label one point as (x 1 , y 1) and the other (x 2 , y2 )
Use the slope formula to find the slope (y 2- y1)/ (x 2- x1)

10
Multiple Choice

What is the slope of the line?
11
Multiple Choice

What is the slope of the line?
12
Multiple Choice

What is the slope of the line?
13
Slope from Graph (rise over run)
Locate an anchor point - try to find one that is exactly on the intersection of a grid
Locate a "destination" point - try to find one that is exactly on the intersection of a grid
Count the units up or down from your anchor point to the destination point : up is positive and down is negative. This is your rise (numerator)

14
Slope from Graph
Count the units to the right or left from your anchor point to your destination point: right is positive, left is negative. this is your denominator
anchor point (1, 4)
destination point (4,2)
Go down 2 (= -2) to the right 3 (=+3)
Slope is -2/3

15
Multiple Choice

Find the slope of the line.
16
Multiple Choice

Find the slope of the line.
17
Multiple Choice

Find the slope of the line.
18
Multiple Choice

Find the slope of the line.
19
Slope from Slope-Intercept Form
Slope intercept: y = mx + b
m = slope; b = y-intercept
The slope is always the coefficient of the x-term
y = 5x - 4; slope = 5
y = -1/2 x; slope = -1/2
y = 5; no x-term so coefficient must be 0; slope = 0

20
Multiple Choice
21
Multiple Choice
22
Multiple Choice
23
Slope and Rate of Change
Slope and Rate of Change mean the same
Usually we refer to slope when we talk about the slant of a linear function, and rate of change refers to the change between points in all types of functions

24
Slope and Rate of Change
Slope also refers to the line, while rate of change makes more sense when we talk about how the dependent variable changes with respect to the dependent variable

25
Multiple Choice

26
Multiple Choice

Find the rate of change.
27
Multiple Choice
Find the rate of change.
Slope of a Line
Show answer
Auto Play
Slide 1 / 27
SLIDE
