Search Header Logo
Senior Final Exam Review.1

Senior Final Exam Review.1

Assessment

Presentation

Mathematics

12th Grade

Medium

CCSS
HSS.ID.B.5, HSF-LE.A.1C, 8.SP.A.1

+9

Standards-aligned

Created by

Kurt Parchment

Used 6+ times

FREE Resource

6 Slides • 23 Questions

1

Senior Final Exam Review

Slide image

2

Unit 4 Review

  • Scatterplots display bivariate data.

  • Scatterplots are discrete. (not connected)

  • Scatterplots are described by form, direction and Strength

  • Form: Linear/Non Linear

  • Direction:Postive/Negative

  • Strength: Strong/Weak

3

Scatterplots are used to

  • find trend line (Linear Regression)

  • make predictions


4

Multiple Choice

Question image

Based on the scatterplot, what is the best prediction of the resting heart rate of a person who exercises an average of 8 hours each week?

1

30 beats per minute

2

50 beats per minute

3

40 beats per minute

4

60 beats per minute

5

Multiple Choice

Name the correlation in this sentence: The average temperature in a city and the number of speeding tickets in the city.

1

Lots of correlation

2

Negative correlation

3

No correlation

4

Positive correlation

6

Multiple Choice

Question image

Name the correlation in this graph

1

Positive correlation

2

Negative correlation

3

No correlation

4

Lots of correlation

7

Multiple Choice

Question image

Which Scatterplot best represents the data?

1

A

2

B

3

C

4

D

8

Multiple Choice

Question image

Five cups of hot chocolate were sold when the temperature was 45 degrees Fahrenheit, . Which ordered pair shows this data on the scatter plot?

1

(45,50)

2

(5,45)

3

(45,5)

4

(5,40)

9

Multiple Choice

Question image

Which ordered pair would NOT represent a point on a scatter plot of this data?

1

(6,12)

2

(3,9)

3

(3,18)

4

(11,30)

10

Unit 5 Modeling with Functions

  • Linear Regression: use desmos  y1mx1+by_1\sim mx_1+b  

11

Multiple Choice

Question image
The scatter plot shows the relationship between the number of chapters and the total number of pages for several books.  Use the trend line to predict how many chapters would be in a book with 180 pages. 
1
12 chapters
2
15 chapters
3
18 chapters
4
21 chapters

12

Multiple Choice

Question image
Find the equation of the Line of Best Fit from the data set. 
1
y = 0.892x - 1.82
2
y = 1.82x - 5.02
3
y = 0.796x + 5.02
4
y = 1.82x + 5.02

13

Multiple Choice

Question image

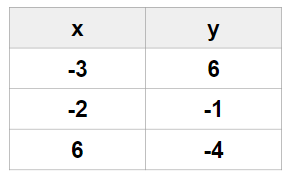
Write the linear regression equation for the following data points. Round to the nearest hundredth.

1

y=0.83x+0.61y=-0.83x+0.61

2

y=0.83x+0.63y=-0.83x+0.63

3

y=0.83x+0.8y=0.83x+-0.8

4

a2+b2=c2a^2+b^2=c^2

14

Multiple Choice

Question image

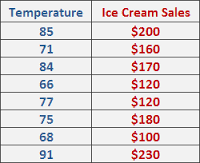
Find the equation of the line of best fit for the given data

1

y = 163.41x+1.49

2

y =- 163.41x+ 4.19

3

y =- 4.19x+163.41

4

y = 4.19x -163.41

15

Multiple Choice

Question image
The chart below tracts starting salaries for health care workers since the year 2000. Using linear regression, find the equation of best fit. Round decimals to 3 places.
1
y = 839.721x + 27541.812
2
y = 27541.812x - 839.721
3
y = 27541.812x + 839.721
4
y = 839.721x - 27541.812

16

Multiple Choice

Question image
A person travels by car.  They record their miles driven in a data table.  Calculate the linear regression equation of this data.
1
y = 61.93x - 1.79
2
y = -1.79x + 61.93
3
y = 0.016x + 0.03
4
y = 0.03x + 0.016

17

Non Linear Models

  • Exponential J-shaped (The y-values are being multiplied by a common ratio)

  • Sinusoidal /Sine the value cycle [swimsuit sales, length of daylight, tides]

  • logistic (s-curve) [swine-flu, covid19, population growthzombie, vampire]

  • piecewise-[Hurricane category, postage rates]

18

Multiple Choice

Question image

What type of function

1

Linear

2

Piecewise

3

Logistic

4

Sine

19

Multiple Choice

Question image

Exponential population growth can be described as

1

growth when resources are limited

2

a j-shaped curve

3

a s-shaped curve

4

growth that reaches carrying capacity

20

Multiple Choice

Question image
What type of growth is shown in the diagram?
1
exponential growth
2
logistic growth 
3
predator-prey cycle
4
boom-bust curve

21

Multiple Choice

Question image

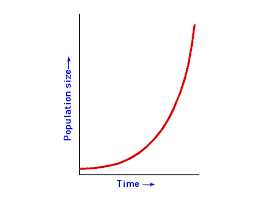
Is this graph showing exponential growth or logistical growth?

1

Exponential

2

logistical

22

Unit 6

Compound Interest

Comparing Salaries (Annual, Monthly, Hourly)

Gross pay to Net Pay

Deductions

(social security, medicare, federal income tax, etc.)


23

Multiple Choice

Principal: $999
Interest Rate: 5.45%
Time: 19 years
Compounded Quarterly
State the future account balance.
1
$2794.10
2
$2738.11
3
$2774.98
4
$2807.11

24

Multiple Choice

Karla invested $1,000 in savings bonds. If the bonds earn 6.75% interest compounded semi-annually, how much total will Karla earn in 15 years?
1
$1,584.62
2
$2,651.39
3
$2,706.86
4
$1,825.10

25

Multiple Choice

Hei-Hei has $1500 in a retirement account earning 5% interest compounded annually. After 5 years how much does Hei-Hei have in the account?

1

$1750

2

$2010.14

3

$2500

4

$1914.42

26

Multiple Choice

Jacob borrows $500 from Abraham and agrees to have the loan compounded annually for 5 years with an interest rate of 2.5%. How much will the total amount be that Jacob owes?

1

$565.70

2

$262609.38

3

$65.70

4

$630.20

27

Multiple Choice

Net income is:
1
the total amount of money you earn before deductions.
2
the amount of money you receive AFTER deductions are subtracted from your gross income
3
a debt or money that is owed to someone.
4
the hourly rate of pay

28

Multiple Choice

Gross income minus deductions equal your net income.
If Amorelle made $384 in gross income and her deductions are $122, what is her net income?
1
$506
2
$406
3
$262
4
$266

29

Multiple Choice

What are your TOTAL DEDUCTIONS, if your deductions are as follows:

Income Tax $154.53

NIS $56.74

Education Tax $14.15

Health Insurance Premiums $48?

1

$236.47

2

$198.47

3

$190.80

4

$273.42

Senior Final Exam Review

Slide image

Show answer

Auto Play

Slide 1 / 29

SLIDE