
Measures of Spread
Presentation
•
Mathematics
•
6th - 10th Grade
•
Medium
+2
Standards-aligned

Zanier Fuller
Used 13+ times
FREE Resource
4 Slides • 37 Questions
1
2
3

4
Multiple Choice
5
Multiple Choice
6
Multiple Choice
7
Multiple Choice
8
Multiple Choice

9
Multiple Choice
10
Multiple Choice
11
Multiple Choice
12
Multiple Choice
13
Multiple Choice
14
Multiple Choice
15
Multiple Choice

16
Multiple Choice
17
Multiple Choice
18
Multiple Choice
19
Multiple Select
20
Multiple Choice

What is the deviation from the mean for the Astros?
21
Multiple Choice
22
Multiple Choice
23

24
Multiple Choice

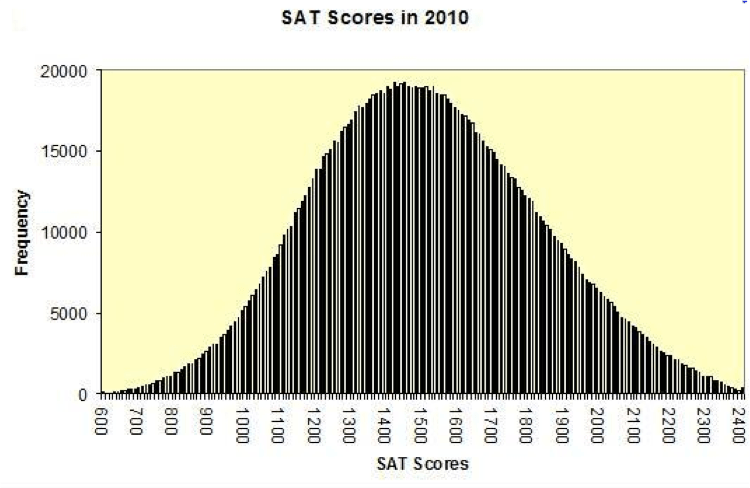
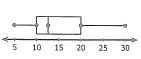
What is the shape of the Data Set?
25
Multiple Choice

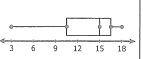
What is the shape of the Data Set?
26
Multiple Choice

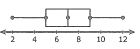
What is the shape of the Data Set?
27
Multiple Choice
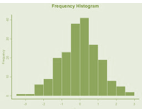
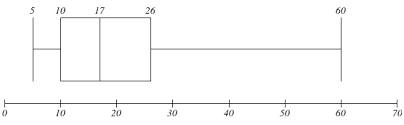
Describe the shape of the graph.
28
Multiple Choice
How would you describe this data?
29
Multiple Choice
30
Multiple Choice

31
Multiple Choice

True or false, the data is skewed.
32
Multiple Choice
33
Multiple Choice
34
Multiple Choice
35
Multiple Choice
36
Multiple Choice
What is the shape of the distribution?
37
Multiple Choice

What is the shape of the Data Set?
38
Multiple Choice

What is the shape of the Data Set?
39
Multiple Choice

What is the shape of the Data Set?
40
Multiple Choice

What is the shape of the Data Set?
41
Multiple Choice

What is the shape of the Data Set?
Show answer
Auto Play
Slide 1 / 41
SLIDE
