Search Header Logo
  1. Resource Library
  2. Math
  3. Probability And Statistics
  4. Sample Space
  5. Intro To Probability
Intro to Probability

Intro to Probability

Assessment

Presentation

Mathematics

10th Grade

Medium

CCSS
7.SP.C.7B, HSS.CP.A.1, 7.SP.C.8B

+2

Standards-aligned

Created by

Erin Inman

Used 40+ times

FREE Resource

3 Slides • 19 Questions

1

media

The list of all possible outcomes is called the SAMPLE SPACE.

Probability is often defined as how likely something is to happen.

2

Multiple Choice

Sample space is defined as...
1

the likelihood of an event occurring.

2

a diagram of all possible outcomes.

3

the probability of an event.

4

a list of all possible outcomes.

3

Multiple Choice

The cafeteria is serving three kinds of sandwiches:  tuna (T), chicken, (C), and peanut butter (P).  They are also serving a choice of two drinks:  milk (M) or water (W).  Which shows the CORRECT Sample Space List of possible combinations?
1

TW, CW, PW

2

TW, TM, TC, CW, PW

3

TW, TM, CW, CM, PW, PM

4

TCP, MW

4

Multiple Choice

Question image
Which shows the sample space for flipping two coins?
1

H, T

2

HH, HT, TH, TT

3

HH, TT

4

Dime, Nickel

5

Multiple Choice

Question image

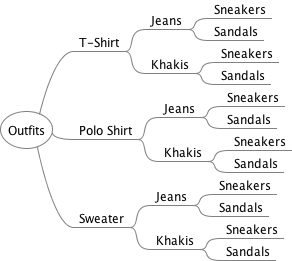
The tree diagram shows the sample space for picking an outfit from a choice of 3 shirts, 2 pants, and 2 shoes options. How many total outfit options are represented? (what is the total number in the sample space)

1

12

2

22

3

7

4

21

5

8

6

media

We use ratios to show how likely, or unlikely, an outcome might be.  This ratio is called the probability of the event.  A probability is expressed as:

Intuitive Idea of Probability

7

Multiple Choice

When figuring the probability of an event, what number goes on bottom of your fraction?

1

The number of the desired event

2

The total number of choices possible

3

The event that happens most

4

The event that happens least

8

Multiple Choice

When figuring the probability of an event, what number goes on top of your fraction?

1

The number of the desired event

2

The total number of choices possible

3

The event that happens most

4

The event that happens least

9

Multiple Choice

Question image

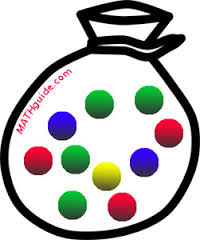
Find P(red marble)...

1

3/10

2

3/9

3

1/9

4

1/3

10

Multiple Choice

Question image

What is the probability of spinning the spinner and landing on a number greater than 6?

1

38\frac{3}{8}  

2

0

3

  68=34\frac{6}{8}=\frac{3}{4}  

4

28=14\frac{2}{8}=\frac{1}{4}

11

Multiple Choice

Question image
Find the probability of rolling greater than a 1 on a single die.
1

6/6

2

5/6

3

  68=34\frac{6}{8}=\frac{3}{4}  

4

1/6

12

Multiple Choice

A bag has 7 marbles: 2 green, 2 blue, and 3 orange. What is the probability of reaching in and NOT pulling out a green?

1

2/7

2

3/7

3

4/7

4

5/7

13

Multiple Choice

An event has a 0% chance of happening. This event is ___.

1

Impossible

2

Unlikely

3

As likely as not

4

Likely

5

Certain

14

Multiple Choice

A bag has 7 marbles: 2 green, 2 blue, and 3 orange. What is the probability of reaching in and pulling out a red marble?

1

2/7

2

3/7

3

4/7

4

0

15

Multiple Choice

Question image

CHALLENGE: Given the image of the two squares, find the probability of a point being in the shaded area.

1

412=13\frac{4}{12}=\frac{1}{3}

2

26=13\frac{2}{6}=\frac{1}{3}

3

436=19\frac{4}{36}=\frac{1}{9}

4

432=18\frac{4}{32}=\frac{1}{8}

16

Multiple Choice

Question image

CHALLENGE: Given a point lands in the rectangle, find the probability of the point being in the shaded area.

1

2436=23\frac{24}{36}=\frac{2}{3}

2

3660=35\frac{36}{60}=\frac{3}{5}

3

1860=310\frac{18}{60}=\frac{3}{10}

4

1842=37\frac{18}{42}=\frac{3}{7}

5

2460=25\frac{24}{60}=\frac{2}{5}

17

media

Venn diagrams can be used to express the logical (in the mathematical sense) relationships between various sets.

The following Venn diagram shows a breakdown of a small high schools sports program.

Venn Diagrams

18

Multiple Choice

Question image

The following Venn diagram shows a breakdown of a small high schools sports program. How many students play only Tennis?

1

14

2

21

3

18

4

7

19

Multiple Choice

Question image

The following Venn diagram shows a breakdown of a small high schools sports program. How many students play basketball and tennis?

1

10

2

13

3

7

4

5

20

Multiple Choice

Question image

The following Venn diagram shows a breakdown of a small high schools sports program. How many students that play a sport do not play basketball?

1

26

2

28

3

30

4

13

5

33

21

Multiple Choice

Question image

The following Venn diagram shows a breakdown of a small high schools sports program. How many students that play baseball or softball?

1

12

2

25

3

22

4

13

5

38

22

Multiple Choice

Question image

The following Venn diagram shows a breakdown of a small high schools sports program. How many students attend this school?

1

628

2

592

3

613

4

552

5

not enough information

media

The list of all possible outcomes is called the SAMPLE SPACE.

Probability is often defined as how likely something is to happen.

Show answer

Auto Play

Slide 1 / 22

SLIDE