Search Header Logo
Number Lines and Line Plots (MD 6. and MD 9)

Number Lines and Line Plots (MD 6. and MD 9)

Assessment

Presentation

English

2nd Grade

Medium

CCSS
2.MD.D.9, 3.MD.B.4, 1.MD.C.4

+16

Standards-aligned

Used 14+ times

FREE Resource

21 Slides • 47 Questions

1

2.MD.6 and 2.MD.9

Using Number lines and Line Plots

2

media

3

media

4

media

5

media

6

media

7

Multiple Choice

Question image

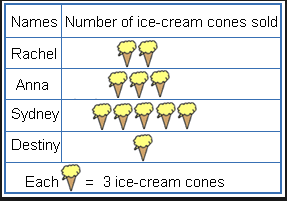
How many apples were there?

1

1

2

2

3

3

4

4

8

Multiple Choice

Question image
How many students favorite pet was a cat?
1

5

2

10

3

4

4

15

9

Multiple Choice

Question image

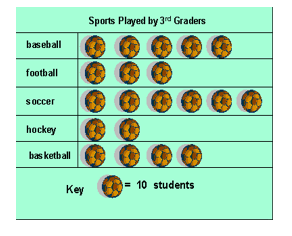
How many students liked basketball?

1

4

2

30

3

40

4

5

10

Multiple Choice

Question image

Which animal did kids like most?

1

cat

2

dog

3

rabbit

11

Multiple Choice

Question image

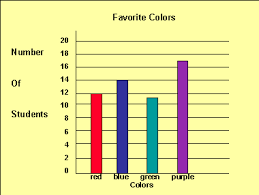
How many more people like the color purple than blue?

1

1

2

3

3

6

4

8

12

Multiple Choice

Question image

How many students scored an 80 or higher on the math test?

1

3

2

5

3

14

4

13

13

Multiple Choice

Question image

Which fruit was the most favorite?

1

Apple

2

Orange

3

Graph

4

Banana

14

Multiple Choice

Question image

Which sport did kids like most?

1

Soccer

2

Softball

3

Basketball

4

Other

15

Multiple Choice

Question image

How many students scored a 90 on the math test?

1

90

2

5

3

6

4

0

16

Multiple Choice

Question image

Which lunch choice was the least favorite?

1

Hot Dog

2

Pizza

3

Submarine Sandwich

4

Hamburger

17

Multiple Choice

Question image

How many more students liked blue balloons than pink?

1

1

2

4

3

7

4

3

18

Multiple Choice

Question image

Look at the bar graph, "Nicest Fruit". What does the x-axis show?

1

Types of fruit

2

The number of people.

19

Multiple Choice

Question image
How many cones were sold in all?
1
16
2
21
3
11
4
33

20

Multiple Choice

Question image

How many students scored a 95 on the math test?

1

3

2

1

3

0

4

2

21

Multiple Choice

Question image
How many days were either rainy or partly cloudy?
1
8
2
5
3
3
4
7

22

Multiple Choice

Question image

Look at the bar graph, "Nicest Fruit". What does the y-axis show?

1

Types of fruit

2

Number of people.

23

Multiple Choice

Question image
How many more books did the class read in June than April?
1
15
2
25
3
10
4
20

24

Multiple Choice

Question image
How many books did the class read in May and July?
1
70
2
25
3
65
4
75

25

Multiple Choice

Question image

Look at the Bar Graph "Student Grades". Which grade did the smallest number of students get?

1

A

2

B

3

C

4

D

26

Multiple Choice

Question image

How many students scored a 90 or lower on the math test?

1

12

2

5

3

13

4

7

27

Multiple Choice

Question image
How many students' favorite color is blue?
1
11
2
12
3
14
4
17

28

Multiple Choice

Question image
1

Ginger Snap

2

Oatmeal Cookie

3

Sugar Cookie

29

Multiple Choice

Question image

How many flowers are 3 inches tall?

1

3

2

2

3

5

4

4

30

Multiple Choice

Question image
How many more people like red than purple?
1
100
2
10
3
2
4
5

31

Multiple Choice

Question image
How many people voted for red as their favorite color?
1
100
2
2
3
4
4
9

32

Multiple Choice

Question image

How many flowers are 3 1/2 inches or taller?

1

5

2

4

3

7

4

13

33

Multiple Choice

Question image

Which cereal was most popular?

1

Corn Flakes

2

Cheerios

3

Life

4

Kix

34

media

35

Multiple Choice

Question image

How many more boys picked basketball than girls?

1

1

2

4

3

5

4

6

36

Multiple Choice

Question image

How many flowers were measured for the data in this line plot?

1

6

2

15

3

3

4

18

37

Multiple Choice

Question image

How many students were surveyed in all?

1

21

2

17

3

22

4

23

38

media

39

Multiple Choice

Question image

How many more students picked fruit than crackers and popcorn?

1

2

2

5

3

7

4

9

40

Multiple Choice

Question image

How many more flowers measured 3 1/2 inches that 4 inches?

1

9

2

1

3

3

4

5

41

Multiple Choice

Question image

How many more red and orange M&Ms were in the bag than yellow?

1

35

2

30

3

25

4

20

42

Fill in the Blank

Type answer...

43

Multiple Choice

Question image

What was the shortest length a frog was able to hop?

1

5 feet

2

2 feet

3

1 foot

4

6 feet

44

Fluency

3 minutes

45

Multiple Choice

Question image

How many frogs jumped 4 feet or 3 feet?

1

7

2

10

3

2

4

6

46

Fill in the Blank

Type answer...

47

Multiple Choice

345 - 183

1

242

2

162

3

252

4

582

48

Fill in the Blank

Type answer...

49

Multiple Choice

752 - 547

1

205

2

215

3

1299

4

115

50

Multiple Choice

Question image
How many students had more than 6 candy bars?
1
5
2
2
3
3
4
1

51

media

52

Multiple Choice

Question image
How many kids wore walking shoes to school today?
1
7
2
10
3
9
4
6

53

media

54

Multiple Choice

Question image
How many people had 3 pets?
1
5
2
7
3
4
4
3

55

media

56

Multiple Choice

Question image

How many more students like finger chips more than candy?

1

1

2

2

3

3

4

4

57

media

58

Multiple Choice

Question image
How many people went to the amusement park fewer than 3 times?
1
1
2
2
3
10
4
8

59

media

60

Multiple Choice

Question image
What was the day with the least amount of cars sold? 
1
Monday
2
Tuesday
3
Wednesday
4
Thursday

61

media

62

Fill in the Blank

Type answer...

63

media

64

media

65

media

66

media

67

media

68

media

2.MD.6 and 2.MD.9

Using Number lines and Line Plots

Show answer

Auto Play

Slide 1 / 68

SLIDE