

Dupont Analysis-UWF Dr.Lucas Long

Presentation
•
Fun
•
KG - Professional Development
•
Practice Problem
•
Medium

Long Lucas
Used 24+ times
FREE Resource
23 Slides • 13 Questions
1
Open Ended

You’re about to go on a date. Two people are interested in you. Both look great on Instagram—perfect smiles, fun vacations, fancy clothes. But… before you decide who to go out with, what do you do?
2
Open Ended

Now you are about to make a big investment, there are two companies you like, for example: Costco vs Sam's Club, before you make a decision, what do you do?
3
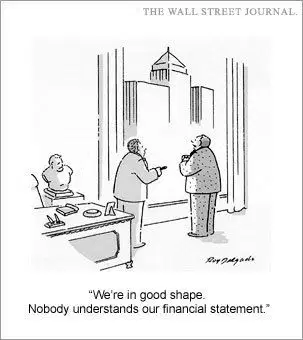
A resume tells the story of a person's career—their skills, experience, and achievements.
A company doesn’t have a resume; instead, it has financial statements, which tell the story of its financial performance and position.
4
Multiple Choice
Which of the following are not financial statements?
Income Statement
Balance Sheet
Cash Flow Statement
Statement of Human Resources
5
The balance sheet is like peeking into their closet and bank account. Do they actually own that Tesla, or is it all on credit cards? What do they truly have versus what they owe? Equity is basically: what’s really theirs after clearing the debts.
The income statement is like looking at their monthly lifestyle. Do they bring in steady income? Do they spend it all on Starbucks and Coachella tickets? At the end of the month, are they building savings—or just surviving paycheck to paycheck?
The cash flow statement is like opening their wallet. Are they flush with cash, or do they look rich but are secretly broke? Remember: Some people look amazing on paper but can’t even pay for dinner.
6
Ratios are like those little comparisons your best friend makes when you’re gossiping: ‘Okay, he makes $70K a year, but spends $65K on sneakers.’ Or: ‘She saves 30% of her income every month—that’s serious long-term partner material.’
Common-size statements are like dating profiles on apps—you scale everything down so you can compare apples to apples. You don’t care if one person makes $30K and another makes $300K—you want to know what percentage goes to rent, food, debt, and savings. That’s how you see who’s financially stable, not just flashy.
7
Multiple Choice
Person A : Earns $50k.
Person B : Earns $200k.
So Person B earns 4 times as much as Person A ($200k vs $50k), so should be about 4 times as rich, right?
True
False
8
What if both person spends 30K per year.
Person A Keeps: $20k ($50k - $30k)
Person B Keeps: $170k ($200k - $30k)
The Difference: $170k / $20k = 8.5 times!
Because looking at raw dollars hides the power of fixed costs. This is why we use Common Size Statements.
9
Person A: Expenses are 60% of their revenue ($30k/$50k).
Person B: Expenses are only 15% of their revenue ($30k/$200k).
Conclusion: Common size allows us to compare the burden of expenses. For Person A, the expense is a crushing weight (60%). For Person B, the exact same expense is light (15%). Comparability isn't just about dollars; it's about impact.
10
And that’s exactly what we’re learning today. Companies are just like potential dates. They all look good in commercials and on social media, but if you want to decide who you’ll ‘date’ with your money—who you’ll invest in—you’ve got to dig into their resume: their financial statements.”
11
Multiple Choice
In order to calculate the common size income statement, you should divide each item by______?
Total Asset
Net Profit
Gross Profit
Total Revenues
12
Multiple Choice
Which of the following is not quick asset?
Cash
Market Securities
Account Receivable
Inventory
13


Peter Parker vs Flash Thompson
14
We will compare Peter Parker and Flash Thompson’s personal finances to evaluate true financial health.
Flash Thompson: High influencer income ($150,000), driven by family money and book deals, but burdened by massive lifestyle inflation and depreciating luxury assets.
Peter Parker: Modest freelance income ($45,000) with a heavy baseline housing burden, but offset by extremely lean operating expenses.
The Trap: Flash earns more than triple Peter's revenue, but common-size statements will reveal who actually keeps more of their wealth.
15

Look Beyond Raw Dollars: Understand why top-line revenue is a misleading metric for financial stability.
Expense Proportionality: Use common-size statements to identify dangerous burn rates and lifestyle creep as percentages of total income.
Liquidity & Resilience: Evaluate current ratios to determine who has the buffer to survive a sudden financial shock, such as a canceled endorsement or broken equipment.
16


17
18

19
DuPont Analysis is a method used to break down the Return on Equity (ROE) into three parts:
Profit Margin (Understanding Profitability),
Total Asset Turnover (Assessing Efficiency),
Equity Multiplier (Evaluating Leverage).
20
Poll
If the return on equity (ROE) of two companies is very similar, which one would be your preference for investment?
NetFlix
Microsoft


24
Company | ROE (%) | Profit Margin (PM) (%) | Total Asset Turnover (TAT) | Equity Multiplier (EM) |
Netflix (NFLX) | 32.09 | 13.22 | 0.892 | 2.752 |
Microsoft (MSFT) | 32.83 | 33.05 | 0.474 | 2.114 |
Google (Alphabet) (GOOGL) | 29.15 | 21.84 | 0.606 | 2.236 |
Netflix (NFLX)
Profit Margin: Netflix has a lower profit margin compared to Microsoft and Google. This is due to high content production and acquisition costs as Netflix continues to invest heavily in original content to stay competitive
Total Asset Turnover: Netflix has a higher TAT, indicating efficient use of its assets to generate revenue. This is likely due to its subscription-based model which generates consistent revenue from a large user base
Equity Multiplier: Netflix has a higher EM, suggesting it uses more debt relative to equity. This can be attributed to its aggressive investment strategy in content and technology.
25
Company | ROE (%) | Profit Margin (PM) (%) | Total Asset Turnover (TAT) | Equity Multiplier (EM) |
Netflix (NFLX) | 32.09 | 13.22 | 0.892 | 2.752 |
Microsoft (MSFT) | 32.83 | 33.05 | 0.474 | 2.114 |
Google (Alphabet) (GOOGL) | 29.15 | 21.84 | 0.606 | 2.236 |
Microsoft (MSFT)
Profit Margin: Microsoft boasts a high-profit margin due to its diversified product portfolio, including high-margin software products like Windows and Office, as well as its cloud services.
Equity Multiplier: Microsoft has a lower EM, indicating a more conservative use of debt. This aligns with its strong cash flow and financial stability.
26
Company | ROE (%) | Profit Margin (PM) (%) | Total Asset Turnover (TAT) | Equity Multiplier (EM) |
Netflix (NFLX) | 32.09 | 13.22 | 0.892 | 2.752 |
Microsoft (MSFT) | 32.83 | 33.05 | 0.474 | 2.114 |
Google (Alphabet) (GOOGL) | 29.15 | 21.84 | 0.606 | 2.236 |
Google (Alphabet) (GOOGL)
Profit Margin: Google’s profit margin is higher than Netflix but lower than Microsoft. This is due to its strong advertising revenue, though it faces high costs in research and development for its various projects.
27

Imagine we’re comparing three friends who are all great at making lemonade: Netflix, Microsoft, and Google. They all make delicious lemonade (high ROE), but they each have their own unique way of doing it. The DuPont analysis helps us understand their secret recipes!
28
Company | ROE (%) | Profit Margin (PM) (%) | Total Asset Turnover (TAT) | Equity Multiplier (EM) |
Netflix (NFLX) | 32.09 | 13.22 | 0.892 | 2.752 |
Microsoft (MSFT) | 32.83 | 33.05 | 0.474 | 2.114 |
Google (Alphabet) (GOOGL) | 29.15 | 21.84 | 0.606 | 2.236 |
Profit Margin (PM): This is like how much profit they make from each glass of lemonade they sell.
Netflix: Their lemonade is tasty but costs a lot to make because they use fancy ingredients (high content costs). So, they don’t make as much profit per glass.
Microsoft: They have a secret recipe that everyone loves (high-margin software and cloud services), so they make a lot of profit per glass.
Google: Their lemonade is popular and they make a good profit, but they also spend a lot on new flavors and experiments (R&D).
29
Company | ROE (%) | Profit Margin (PM) (%) | Total Asset Turnover (TAT) | Equity Multiplier (EM) |
Netflix (NFLX) | 32.09 | 13.22 | 0.892 | 2.752 |
Microsoft (MSFT) | 32.83 | 33.05 | 0.474 | 2.114 |
Google (Alphabet) (GOOGL) | 29.15 | 21.84 | 0.606 | 2.236 |
Total Asset Turnover (TAT): This is like how many glasses of lemonade they can sell with the lemons they have.
Netflix: They sell a lot of lemonade with the lemons they have because they have a big customer base (subscription model).
Microsoft: They sell fewer glasses because they invest in big lemonade stands (data centers) that take time to pay off.
Google: They sell a moderate number of glasses, balancing between popular flavors and new experiments.
30
Company | ROE (%) | Profit Margin (PM) (%) | Total Asset Turnover (TAT) | Equity Multiplier (EM) |
Netflix (NFLX) | 32.09 | 13.22 | 0.892 | 2.752 |
Microsoft (MSFT) | 32.83 | 33.05 | 0.474 | 2.114 |
Google (Alphabet) (GOOGL) | 29.15 | 21.84 | 0.606 | 2.236 |
Equity Multiplier (EM): This is like how much they borrow to buy more lemons and expand their stands.
Netflix: They borrow a lot to buy more lemons and make more lemonade (aggressive investment strategy).
Microsoft: They borrow less because they have a steady flow of customers and money (conservative debt usage).
Google: They borrow a moderate amount, balancing between using their own money and borrowing.
31
Multiple Choice
A firm has a net profit margin of 5.6 percent, a return on assets of 12.5 percent, and an equity multiplier of 1.49. What is the return on equity?
A) 17.14%
B) 18.63%
C) 19.67%
D) 21.69%
E) 22.30%
32
Multiple Choice
A firm has a debt-equity ratio of .62, a total asset turnover of 1.24, and a net profit margin of 5.1 percent. The total equity is $489,600. What is the amount of the net income?
A) $28,079
B) $19,197
C) $50,159
D) $40,451
E) $52,418
33
Multiple Choice
A firm has an equity multiplier of 1.13, a total asset turnover of .56, and a net profit margin of 18.8 percent. What is the return on assets?
A) 9.20%
B) 11.67%
C) 2.40%
D) 11.90%
E) 10.53%
34
Multiple Choice
A firm has a net profit margin of 5.1 percent, a total asset turnover of 1.84, and a return on equity of 16.2 percent. What is the debt-equity ratio?
0.73
0.42
0.81
0.64
0.83
35
Multiple Choice
A firm has a debt-equity ratio of .94. Return on assets is 8.5 percent, and total equity is $520,000. What is net income?
A) $44,200
B) $88,880
C) $85,748
D) $41,548
E) $74,909
36
Multiple Choice
A firm has sales of $2,800, total assets of $1,900, and a debt-equity ratio of .5. Its return on equity is 15 percent. What is net income?
210
130
240
350
190
You’re about to go on a date. Two people are interested in you. Both look great on Instagram—perfect smiles, fun vacations, fancy clothes. But… before you decide who to go out with, what do you do?
Show answer
Auto Play
Slide 1 / 36
OPEN ENDED
Similar Resources on Wayground

31 questions
Review: Function Junction
Presentation
•
7th - 8th Grade
26 questions
HROD Christmas Quiz 2021
Presentation
•
KG
31 questions
Slovin's Formula
Presentation
•
10th Grade
29 questions
Ch. 15 Money & Banking
Presentation
•
9th - 12th Grade
33 questions
Paragraph Writing Essentials Quiz
Presentation
•
8th - 11th Grade
33 questions
Care Team Refresher Course
Presentation
•
KG
31 questions
Gilded Age: Rise of the Populist Party
Presentation
•
4th - 11th Grade
26 questions
Les prépositions de temps (marqueurs temporels)
Presentation
•
6th Grade - University
Popular Resources on Wayground
10 questions
Safety Day 2026 – Student Review

Quiz
•
9th Grade
21 questions
Continents and Oceans
Quiz
•
6th Grade
20 questions
Parts of Speech
Quiz
•
5th Grade
16 questions
Subject & Predicate
Quiz
•
5th Grade
25 questions
Multiplication Facts
Quiz
•
5th Grade
12 questions
Map Skills
Quiz
•
3rd Grade
22 questions
Continents and Oceans
Quiz
•
5th Grade
15 questions
Rounding Decimals
Quiz
•
5th Grade
Discover more resources for Fun
28 questions
SMS Staff by the Numbers
Quiz
•
6th - 8th Grade
26 questions
SLIME!!!!!
Quiz
•
KG - 12th Grade
9 questions
Halloween Candy Quiz
Quiz
•
3rd Grade
13 questions
Halloween Trivia
Quiz
•
9th Grade
10 questions
Disney Characters
Quiz
•
2nd Grade
10 questions
Disney
Quiz
•
7th Grade
20 questions
FAST FOOD Fun!!!
Quiz
•
6th - 8th Grade
18 questions
candy
Quiz
•
8th Grade