Search Header Logo
Pre-Read Isotopes and Atmosphere

Pre-Read Isotopes and Atmosphere

Assessment

Presentation

Science

7th - 10th Grade

Practice Problem

Medium

Created by

Priscilla Rodgers-Giberson

Used 3+ times

FREE Resource

3 Slides • 6 Questions

1

​Look at the graph:

media
  1. ​What is on the x-axis? y-axis?

  2. What is the trend?

2

Multiple Choice

Question image

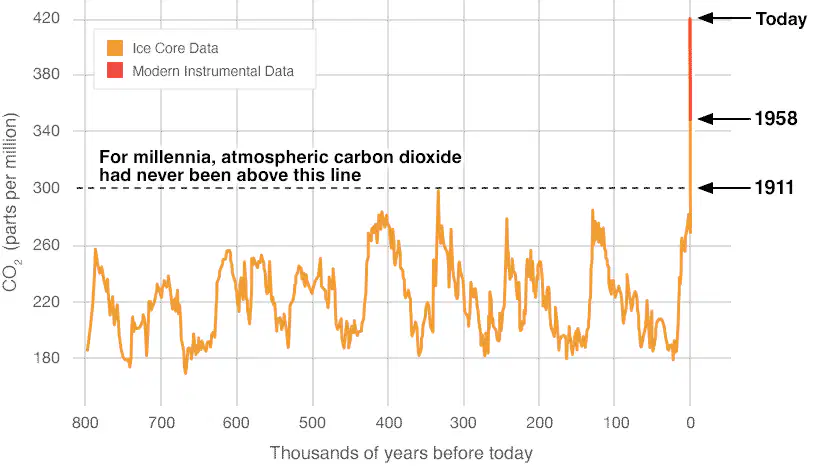
What does the graph measure?

1

Changes in CO₂ over time

2

Changes in temperature over time

3

Changes in sea level over time

4

Change in time over the years

3

Multiple Choice

Question image

How is CO₂ most often been measured?

1

Sensors on Mauno Loa

2

From weather balloons

3

By satellites

4

From ice cores

4

media

​Look at the graph

This graph is measuring concentration of carbon-13 in the atmosphere.

5

Multiple Choice

Question image

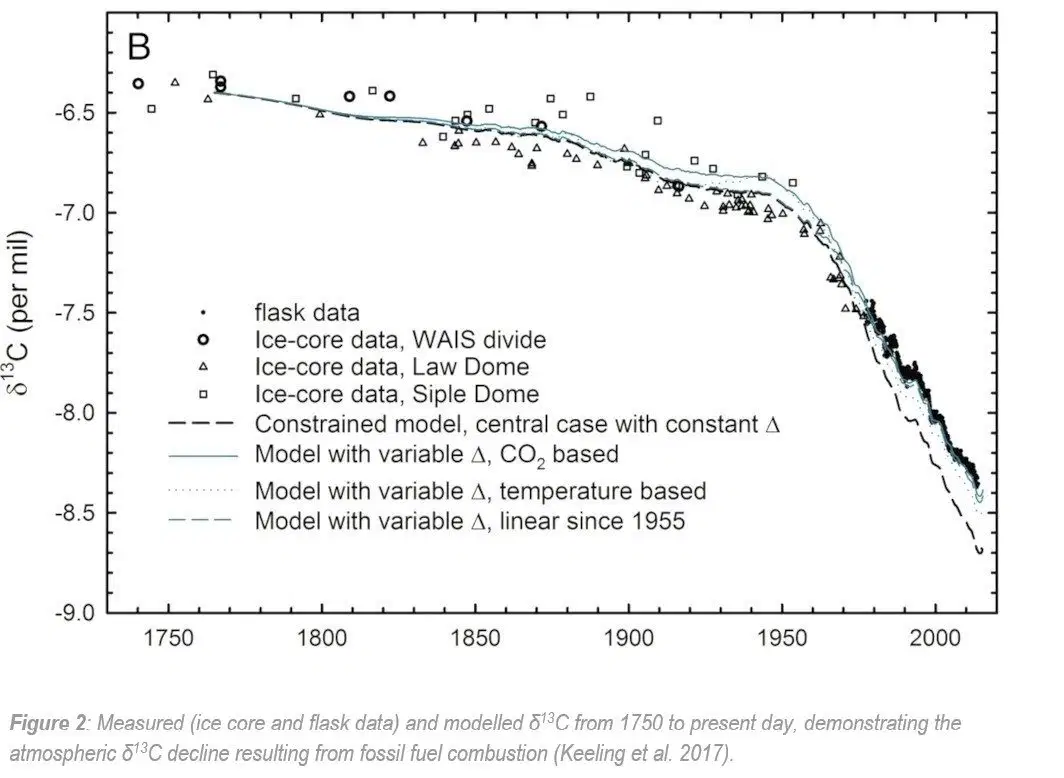
Does this data come from only 1 ice core?

1

yes

2

no

6

Multiple Choice

Question image

Over time, what has happened to the concentration of carbon-13 in the atmosphere.

1

Carbon-13 has increased.

2

Carbon-13 has decreased.

7

media

8

Dropdown

Question image
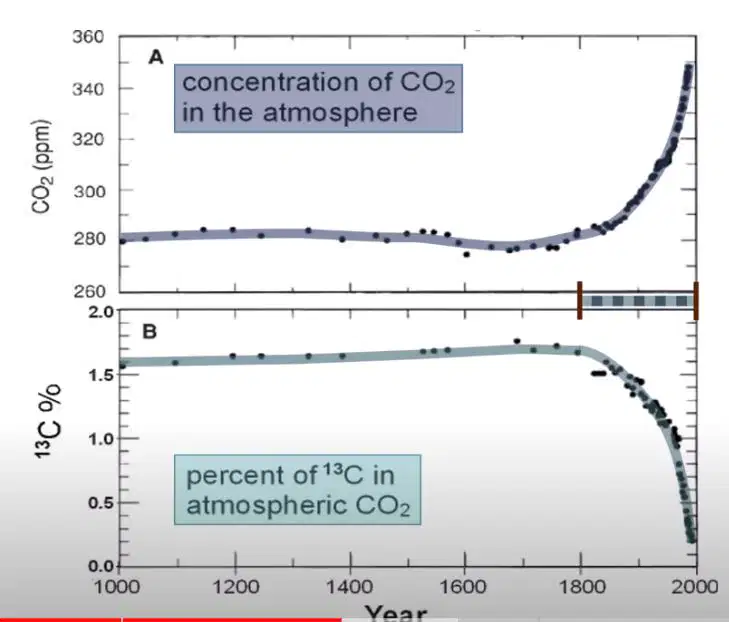
Since the 1800's, as CO2 has increased, the percent of 13C has​

9

Multiple Choice

Question image

Since CO2 is increasing, but 13C is decreasing, what does that mean?

1

There is more 12C - CO2 being produced.

2

There is less CO2 being produced.

3

There is more photosynthesis occuring.

4

There is more 13C - CO2 being produced.

​Look at the graph:

media
  1. ​What is on the x-axis? y-axis?

  2. What is the trend?

Show answer

Auto Play

Slide 1 / 9

SLIDE