
Lesson 09: Slopes Don’t Have to be Positive | Unit 3: Linear Relationships
Presentation
•
Mathematics
•
8th Grade
•
Hard
Standards-aligned
Wayground Content
FREE Resource
27 Slides • 10 Questions
1
2
3
4
5
6
7
8
9

10

11
12
13
14
15
16
17
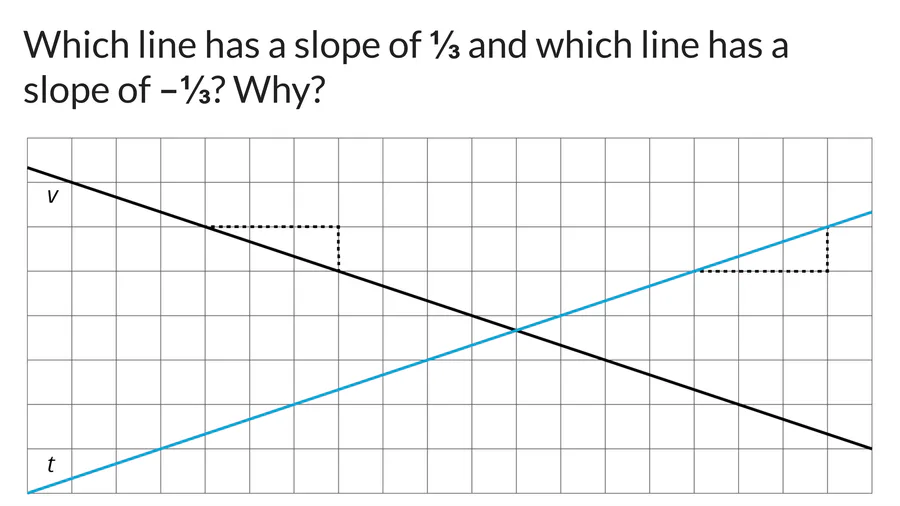
18
19
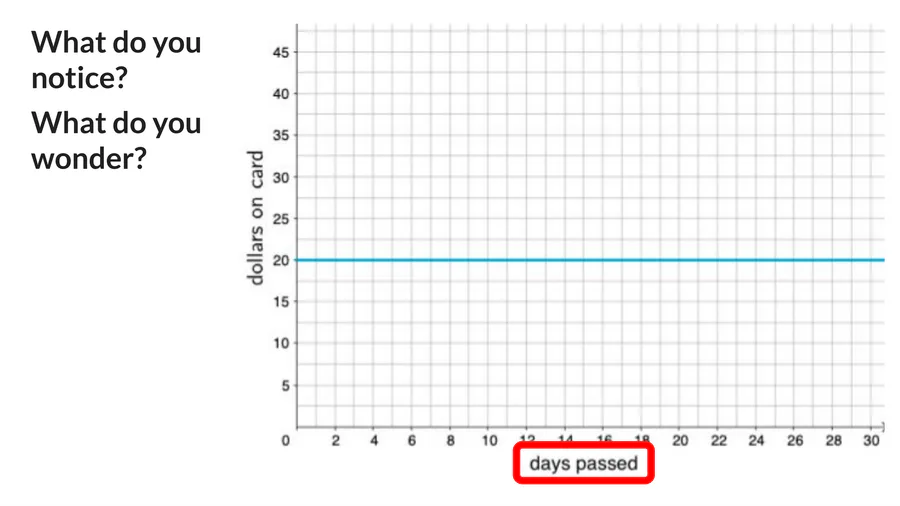
20
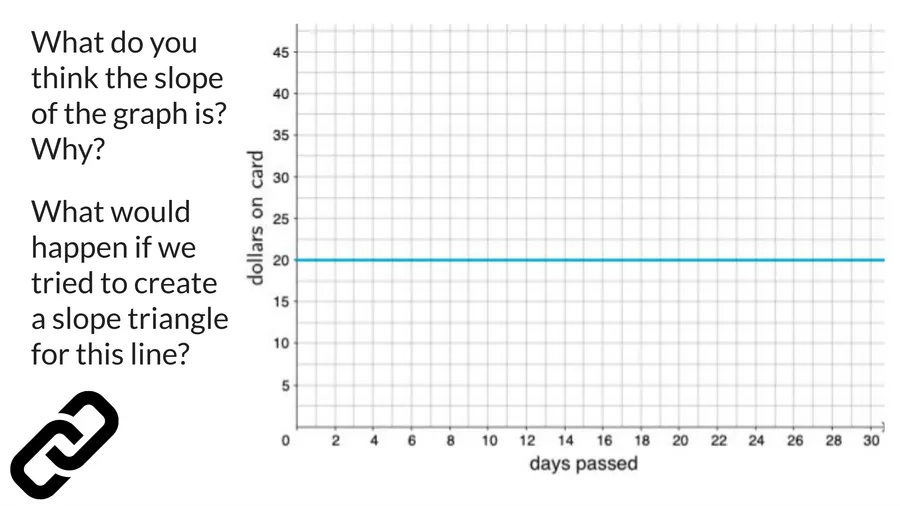
21
22
23
24
25
26
27
28
Multiple Choice
Suppose that during its flight, the elevation e (in feet) of a certain airplane and its time since takeoff t are related by a linear equation. Consider the graph of this equation, with time represented on the horizontal axis and elevation on the vertical axis. Decide if the slope is positive, zero, or negative for the below situation: The plane is cruising at an altitude of 37,000 feet above sea level.
Positive
Zero
Negative
29
Multiple Choice
Suppose that during its flight, the elevation e (in feet) of a certain airplane and its time since takeoff t are related by a linear equation. Consider the graph of this equation, with time represented on the horizontal axis and elevation on the vertical axis. Decide if the slope is positive, zero, or negative for the below situation: The plane is descending at a rate of 1,000 feet per minute.
Positive
Zero
Negative
30
Multiple Choice
Suppose that during its flight, the elevation e (in feet) of a certain airplane and its time since takeoff t are related by a linear equation. Consider the graph of this equation, with time represented on the horizontal axis and elevation on the vertical axis. Decide if the slope is positive, zero, or negative for the below situation: The plane is ascending at a rate of 2,000 feet per minute.
Positive
Zero
Negative
31
Multiple Choice
Each square on a grid represents 1 unit on each side. Find the slope of the line.
−41
41
4
32
Multiple Choice
Each square on a grid represents 1 unit on each side. Find the slope of the line.
−41
41
4
33
Multiple Choice
Each square on a grid represents 1 unit on each side. Find the slope of the line.
−41
41
4
34
Open Ended
Match each graph of a linear relationship to a situation that most reasonably reflects its context. Graph A:
35
Open Ended
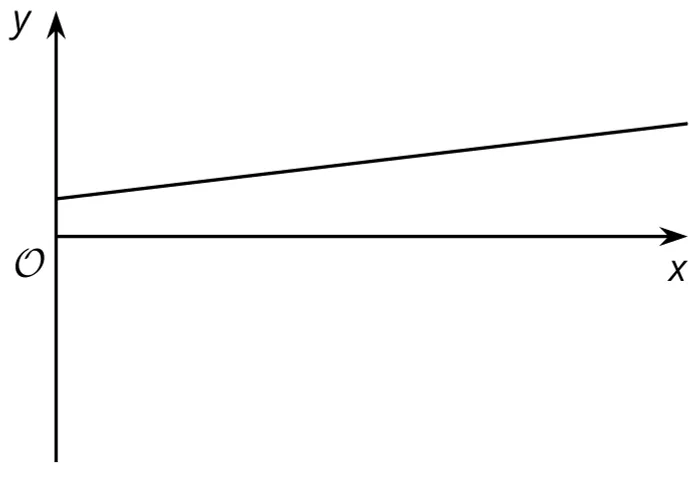
Match each graph of a linear relationship to a situation that most reasonably reflects its context. Graph B:
36
Open Ended
Match each graph of a linear relationship to a situation that most reasonably reflects its context. Graph C:
37
Open Ended
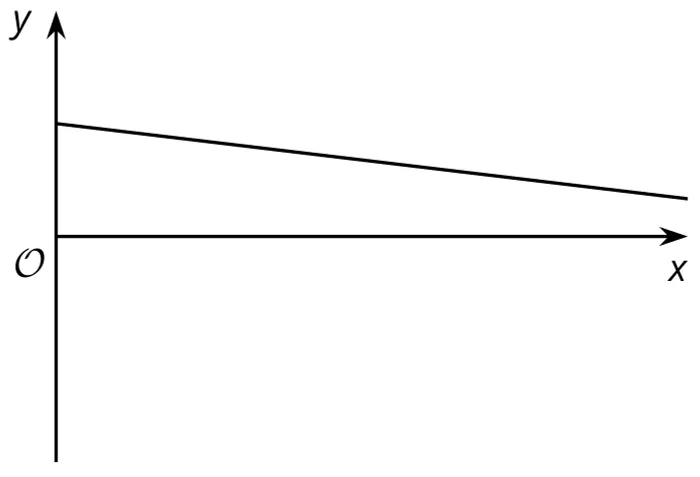
Match each graph of a linear relationship to a situation that most reasonably reflects its context. Graph D:
Show answer
Auto Play
Slide 1 / 37
SLIDE

Similar Resources on Wayground
31 questions
Adding Rational Numbers
Presentation
•
7th - 8th Grade
34 questions
Lesson: Functions and Relations
Presentation
•
8th - 9th Grade
27 questions
IM Lesson 3-6 Grade 8
Presentation
•
8th Grade
33 questions
8th Math review
Presentation
•
8th Grade
33 questions
8th Grade : Transformations (ROTATIONS)
Presentation
•
8th Grade
30 questions
Proportional Relationships: Graphs
Presentation
•
8th Grade
30 questions
10-3 Approximating Irrational Numbers
Presentation
•
8th Grade
32 questions
Word Problems and Equations
Presentation
•
8th - 9th Grade
Popular Resources on Wayground
10 questions
HCS SCI 03 Summer School Review 4
Quiz
•
3rd Grade
11 questions
HSMS - Standard Response Protocol
Quiz
•
6th - 8th Grade
16 questions
1.1-1.2 Quiz Review
Quiz
•
9th - 12th Grade
12 questions
Exponent Expressions
Quiz
•
6th Grade
20 questions
Adding and Subtracting Integers
Quiz
•
6th - 7th Grade
11 questions
Northeast States
Quiz
•
3rd - 4th Grade
10 questions
Characterization
Quiz
•
3rd - 7th Grade
10 questions
Common Denominators
Quiz
•
5th Grade