Search Header Logo
  1. Resource Library
  2. Math
  3. Data And Graphing
  4. ...
  5. Pictographs
Pictographs

Pictographs

Assessment

Presentation

Mathematics

3rd Grade

Hard

Created by

James Gonzalez

FREE Resource

5 Slides • 7 Questions

1

Using Pictographs

Slide image

2

Pictographs = Picture+graph

A pictograph or picture graph uses small pictures or symbols to compare information. Let's try one!

3

Multiple Choice

Question image

How many people ate banana?

1

7

2

5

3

2

4

1

4

Good graphs use a key

  • I key helps you read the graph

  • It shows you how much each symbol is worth.

  • You'll see an example in the next question

5

Multiple Select

A pictograph must always have a... (choose two)

1

Marker

2

Title

3

Cup of coffee

4

A key

6

Multiple Choice

Question image
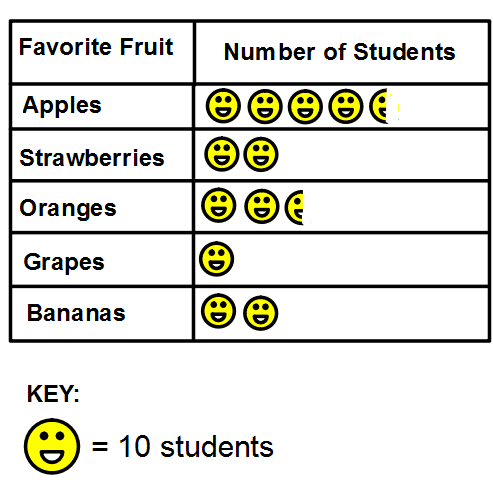
How many students like strawberries the best?
1
2
2
40
3
20
4
10

7

Multiple Choice

Question image

How many strawberries does Ed have?

1

2

2

1

3

4

4

6

8

Reading pictographs

  • Look at the title, the options, the key

  • Figure out what the question is asking you

  • You may need to add or subtract to answer a question about a pictograph

9

Multiple Choice

Question image

How many students play soccer and baseball?

1

90

2

40

3

50

4

110

10

Multiple Choice

Question image

Which topping was more popular? Cheese or sausage?

1

Cheese

2

Sausage

3

They were equally popular

4

Neither one was popular

11

Poll

Do you prefer picture graphs or bar graphs?

Picture graphs

Bar graphs

12

Great work!

  • Take out your CHAPTER 2 Moose Book

  • Open to page 94- we'll review together

  • Page 97 and 98 on your own

Using Pictographs

Slide image

Show answer

Auto Play

Slide 1 / 12

SLIDE