Search Header Logo
  1. Resource Library
  2. Science
  3. Chemistry
  4. Heating Curve
  5. Heating Cooling Curves
Heating Cooling Curves

Heating Cooling Curves

Assessment

Presentation

Science

9th Grade

Hard

Created by

Joseph Anderson

FREE Resource

7 Slides • 22 Questions

1

​U01.L03 :
Heating and Cooling Curves

2

media

3

Fill in the Blank

Type answer...

4

Fill in the Blank

5

media

​It shows how state of matter changes with temperature.

The positive slope means thermal energy is being added.

​Heating

Curve

6

How to Read

  • During a phase change, the temperature does NOT change until every particle has switched phases.

  • Energy is being removed or added, but temperature does not change during the phase change.

  • Temperature changing is demonstrated with the sloped lines.

  • Phase changing is demonstrated with the flat lines.​

7

Multiple Choice

Question image

What label is given to the first flat line on the graph?

1

temperature

2

boiling point

3

melting point

4

time

8

Multiple Choice

Question image

At the first flat line on the graph, what state of matter should we see?

1

mix of solid and liquid

2

mix of liquid and gas

3

mix of solid and gas

4

solid

9

Multiple Choice

Question image

What label is given to the second flat line on the graph?

1

temperature

2

boiling point

3

melting point

4

time

10

Multiple Choice

Question image

At the second flat line on the graph, what state of matter should we see?

1

solid

2

liquid

3

gas

4

mix of liquid and gas

11

Multiple Choice

Question image

The temperature of this substance is always increasing on this graph.

1

true

2

false

12

Multiple Choice

Question image

Thermal energy is always being added on this graph.

1

true

2

false

13

media

​It shows how state of matter changes with temperature.

The negative slope means thermal energy is being removed.

Flat lines indicate the temperature is NOT changing, but the matter is changing states.​

​Cooling

Curve

14

Multiple Choice

Question image

What label is given to the first flat line on the graph?

1

temperature

2

boiling point

3

melting point

4

time

15

Multiple Choice

Question image

At the first flat line on the graph, what state of matter should we see?

1

mix of solid and liquid

2

mix of liquid and gas

3

mix of solid and gas

4

gas

16

Multiple Choice

Question image

What label is given to the second flat line on the graph?

1

temperature

2

boiling point

3

melting point

4

time

17

Multiple Choice

Question image

At the second flat line on the graph, what state of matter should we see?

1

solid

2

liquid

3

mix of solid and liquid

4

mix of liquid and gas

18

Multiple Choice

Question image

The temperature of this substance is always decreasing on this graph.

1

true

2

false

19

Multiple Choice

Question image

Thermal energy is always being removed on this graph.

1

true

2

false

20

Remember!

During a phase change, the temperature does NOT change until every particle has switched phases.

Energy is being removed or added, but temperature does not change.

Temperature changing is demonstrated with the sloped lines.

Phase changing is demonstrated with the flat lines.​

21

Multiple Choice

Question image

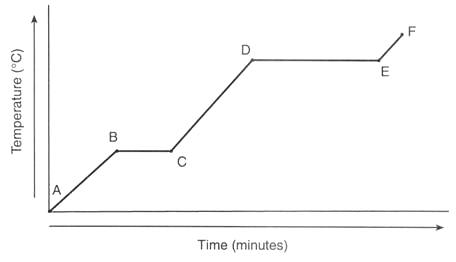
Between which points is the temperature of the substance remaining constant?

1

A-B only

2

A-B, C-D, and E-F

3

B-C only

4

B-C and D-E

22

Multiple Choice

Question image

The melting point of the sample is

1

-60 ºC

2

20 ºC

3

60 ºC

4

100 ºC

23

Multiple Choice

Question image

Which letter indicates where water is in both the solid and liquid phase at the same time?

1

A

2

B

3

C

4

D

5

E

24

Multiple Choice

Question image

In which region(s) does temperature increase?

1

Region C only

2

Regions B and D

3

Regions A, C, and E

4

Regions A and B

25

Multiple Choice

Question image

Describe the substance at letter A.

1

Solid

2

Liquid

3

Melting

4

Evaporating

26

Multiple Choice

Question image

What is the freezing point of the substance?

1

0oC

2

60oC

3

120oC

4

180oC

27

Multiple Choice

Question image

Describe the substance at letter E

1
2
3

28

Multiple Choice

Question image

Given the heating curve of a solid being heated at a constant rate, what is the boiling point of this substance?

1

20°C

2

50°C

3

110°C

4

170°C

29

​You're finished!

Once you submit, check your grade. If you don't like it, you may redo this assignment to improve your score.​

​U01.L03 :
Heating and Cooling Curves

Show answer

Auto Play

Slide 1 / 29

SLIDE