
Statistics and Probability Unit Review
Presentation
•
Mathematics
•
6th - 8th Grade
•
Hard

Joseph Anderson
FREE Resource
15 Slides • 28 Questions
1
Unit 4 Review--Data and Probability

2

3

4

5
Multiple Choice

6
Multiple Choice
7
Multiple Choice
8
Multiple Choice

9
Multiple Choice
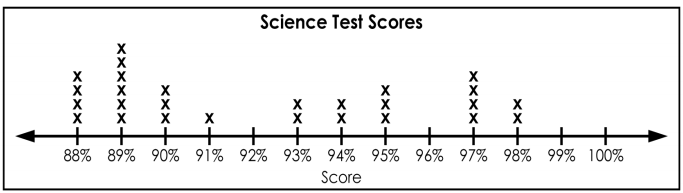
How many students received a score of 94%?
10
Multiple Choice
11

12

13

14

15
Multiple Choice

16
Multiple Choice
17
Multiple Choice

18
Multiple Choice

19
Multiple Choice

20

21

22

23

24
Multiple Choice
25
Fill in the Blanks
26
Fill in the Blanks
27

28
Multiple Choice
29
Multiple Choice
30
Multiple Choice
31
Multiple Select

What is the probability of pulling 5 from this group of without looking. Check all correct answers.
32
Multiple Select

What is the probability of pulling 2 striped marbles from the bag without looking. Check all correct answers.
33
Multiple Choice

How many different ways can we toss a head, and roll a 6?
34
Multiple Choice
How many possible outcomes or combinations can we get if we toss a coin, and roll a number cube?
35
Common Events in Probability
Flipping a Coin [or multiple coins]
Spinning a Spinner
Selecting a card from a Deck of playing cards
pulling a marble from a bag

36
Multiple Choice

What are ALL the possible outcomes of spinning this spinner?
37
Sample Space
This is a list of ALL possible outcomes in a probability event.
We can do this by:
making lists, tables, and tree diagrams

38
Multiple Choice
39
Multiple Choice
40
Multiple Choice
41
Multiple Choice

If you spin two times, what is the probability of landing on yellow, then blue?
42
Multiple Choice

Rolling a number cube then flipping a coin are __________ events.
43
Multiple Choice
Rolling a number cube then flipping a coin are __________ events.
Unit 4 Review--Data and Probability
Show answer
Auto Play
Slide 1 / 43
SLIDE
