- Resource Library
- Math
- Data And Graphing
- Scatter Plot Correlation
- Lecture 6.2 Scatter Plot, Correlation, & Lines Of Fit

Lecture 6.2 - Scatter Plot, Correlation, & Lines of Fit
Presentation
•
Mathematics
•
9th - 12th Grade
•
Practice Problem
•
Easy
•
CCSS
HSS.ID.C.9, HSS.ID.B.5, HSF-LE.A.1B
+4
Standards-aligned

Gabe Geering
Used 1+ times
FREE Resource
13 Slides • 21 Questions
1

2

3
Multiple Choice
4

5
Multiple Choice
6

7
Fill in the Blanks
8

9
Multiple Choice
10
Multiple Choice
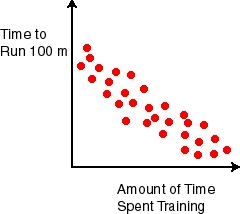
What type of correlation does this scatter plot show?
11
Multiple Choice

What type of correlation does this graph have?
12
Multiple Choice

13
Multiple Choice

14

15
Multiple Select
16
Open Ended
17
Multiple Choice
18
Multiple Choice
19
Multiple Choice
20
Multiple Choice
21

22
Open Ended
23

24
Multiple Choice
25

26
Multiple Choice
27

28
Multiple Choice
29

30
Open Ended
31

32
Fill in the Blanks
33

34
Multiple Choice
Show answer
Auto Play
Slide 1 / 34
SLIDE
