A level 1.2
Authored by Will Hartley
Business
1st Grade
Used 10+ times

AI Actions
Add similar questions
Adjust reading levels
Convert to real-world scenario
Translate activity
More...
Content View
Student View
17 questions
Show all answers
1.
MULTIPLE CHOICE QUESTION
30 sec • 1 pt

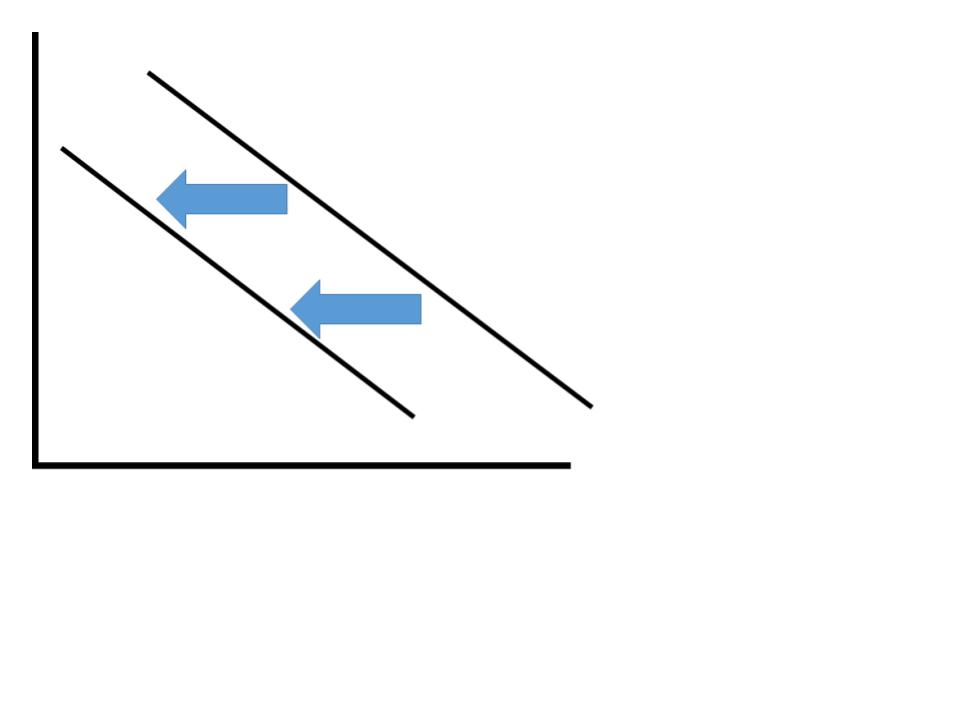
The diagram represents a
shift in demand
movement along the demand curve
2.
MULTIPLE CHOICE QUESTION
30 sec • 1 pt

A new study has shown that avocados are extremely healthy. The demand for avocados has increased due to a change in
3.
MULTIPLE SELECT QUESTION
45 sec • 1 pt

The product is Tesco's own brand baked beans. Which 2 factors could have caused the demand to decrease?
incomes increased
expectation that prices will increase
a decrease in the price of a substitute
increase in market size
4.
MULTIPLE CHOICE QUESTION
5 mins • 1 pt

Which graph below shows the SUPPLY CURVE?
5.
MULTIPLE CHOICE QUESTION
1 min • 1 pt

The diagram represents a(n)
6.
MULTIPLE CHOICE QUESTION
15 mins • 1 pt

The Law of Supply states:
7.
MULTIPLE CHOICE QUESTION
2 mins • 1 pt

Which of the following would not shift the supply curve for iphones?


Access all questions and much more by creating a free account
Create resources
Host any resource
Get auto-graded reports
Continue with Google

Continue with Email
Continue with Classlink
Continue with Clever
or continue with
Microsoft
%20(1).png)
Apple
Others
Already have an account?
