- Resource Library
- Math
- Probability And Statistics
- Empirical Rule
- Exploring The Empirical Rule And Normal Curves
Exploring the Empirical Rule and Normal Curves
Interactive Video
•
Mathematics
•
6th - 10th Grade
•
Practice Problem
•
Hard
+14
Standards-aligned

Lucas Foster
FREE Resource
Standards-aligned
Read more
10 questions
Show all answers
1.
MULTIPLE CHOICE QUESTION
30 sec • 1 pt
What is the main topic of today's lesson?
The history of statistics
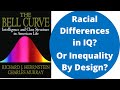
Controversial claims about racial differences in IQ
The development of IQ tests
The impact of education on IQ
2.
MULTIPLE CHOICE QUESTION
30 sec • 1 pt
What shape does a normal curve have?
Linear
S-shaped
Bell-shaped
U-shaped
3.
MULTIPLE CHOICE QUESTION
30 sec • 1 pt
In a normal distribution, what is the relationship between the mean and the median?
The mean is always greater than the median
The mean is always less than the median
There is no relationship
The mean equals the median
Tags
CCSS.6.SP.B.5D
CCSS.HSS.ID.A.2
4.
MULTIPLE CHOICE QUESTION
30 sec • 1 pt
What is the most often cited mean of IQ?
90 points
110 points
100 points
120 points
Tags
CCSS.6.SP.B.5C
5.
MULTIPLE CHOICE QUESTION
30 sec • 1 pt
According to the empirical rule, what percentage of data falls within one standard deviation of the mean?
99.7%
68%
50%
95%
Tags
CCSS.HSS.ID.A.4
6.
MULTIPLE CHOICE QUESTION
30 sec • 1 pt
If an IQ score is 130, what percentile does it fall into?
99th percentile
84th percentile
90th percentile
97.5th percentile
Tags
CCSS.HSS.ID.A.4
7.
MULTIPLE CHOICE QUESTION
30 sec • 1 pt
What score would you need to be at the 84th percentile of IQ scores?
100 points
130 points
145 points
115 points
Tags
CCSS.HSS.ID.A.4
Access all questions and much more by creating a free account
Create resources
Host any resource
Get auto-graded reports
Continue with Google

Continue with Email
Continue with Classlink
Continue with Clever
or continue with
Microsoft
%20(1).png)
Apple
Others
Already have an account?
Popular Resources on Wayground

8 questions
Spartan Way - Classroom Responsible
Quiz
•
9th - 12th Grade
15 questions
Fractions on a Number Line
Quiz
•
3rd Grade
14 questions
Boundaries & Healthy Relationships
Lesson
•
6th - 8th Grade
20 questions
Equivalent Fractions
Quiz
•
3rd Grade
3 questions
Integrity and Your Health
Lesson
•
6th - 8th Grade
25 questions
Multiplication Facts
Quiz
•
5th Grade
9 questions
FOREST Perception
Lesson
•
KG
20 questions
Main Idea and Details
Quiz
•
5th Grade
Discover more resources for Mathematics
12 questions
Review: Surface Area of Rectangular and Triangular Prisms
Quiz
•
6th Grade
20 questions
Scatter Plots and Line of Best Fit
Quiz
•
8th Grade
36 questions
6th Grade Math STAAR Review
Quiz
•
6th Grade
12 questions
8th U6 L4 - Fitting a Line to Data
Quiz
•
8th Grade
14 questions
Volume of rectangular prisms
Quiz
•
7th Grade
25 questions
Scatter Plots and Line of Best Fit
Quiz
•
8th Grade
14 questions
finding slope from a graph
Quiz
•
8th Grade
20 questions
Graphing Inequalities on a Number Line
Quiz
•
6th - 9th Grade