Graphing Concepts and Techniques
Interactive Video
•
Mathematics, Science, Education
•
9th - 12th Grade
•
Practice Problem
•
Hard

Emma Peterson
FREE Resource
Read more
10 questions
Show all answers
1.
MULTIPLE CHOICE QUESTION
30 sec • 1 pt
What is one reason students often make mistakes when graphing data?
Graphing is only important in college.
Graphing skills are assumed to be known as students progress.
Graphing is not taught in elementary school.
They spend too much time on graphing in high school.
2.
MULTIPLE CHOICE QUESTION
30 sec • 1 pt
Why is the Keeling curve considered significant in science?
It shows the annual cycling of oxygen levels.
It measures the amount of rainfall in Hawaii.
It demonstrates the increase in carbon dioxide levels.
It tracks the global temperature changes.
3.
MULTIPLE CHOICE QUESTION
30 sec • 1 pt
Which type of graph is used to show changes over time?
Pie chart
Line graph
Bar graph
Scatter plot
4.
MULTIPLE CHOICE QUESTION
30 sec • 1 pt
What distinguishes a bar graph from a histogram?
Histograms are used for parts of a whole.
Bar graphs compare groups, histograms show distribution.
Histograms have space between columns.
Bar graphs have touching columns.
5.
MULTIPLE CHOICE QUESTION
30 sec • 1 pt
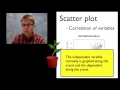
When should a scatter plot be used?
To display data distribution
To correlate two sets of data
To show parts of a whole
To compare different groups
6.
MULTIPLE CHOICE QUESTION
30 sec • 1 pt
What is the primary use of a pie chart?
To show changes over time
To display parts of a whole
To show data distribution
To compare different groups
7.
MULTIPLE CHOICE QUESTION
30 sec • 1 pt
What is an essential element of a good graph?
A descriptive title with detailed information
Non-linear scaling on axes
A title that simply states the topic
Including zero on all axes
Access all questions and much more by creating a free account
Create resources
Host any resource
Get auto-graded reports
Continue with Google

Continue with Email
Continue with Classlink
Continue with Clever
or continue with
Microsoft
%20(1).png)
Apple
Others
Already have an account?
