Analyzing Rate of Change Through Graphs and Real-Life Applications
Interactive Video
•
Mathematics, Physics, Science
•
9th - 10th Grade
•
Practice Problem
•
Hard

Patricia Brown
FREE Resource
Read more
10 questions
Show all answers
1.
MULTIPLE CHOICE QUESTION
30 sec • 1 pt
What is the rate of change in a graph?
The change in y divided by the change in x
The change in x divided by the change in y
The product of x and y changes
The sum of x and y changes
2.
MULTIPLE CHOICE QUESTION
30 sec • 1 pt
Why is it important to include units in your answers when calculating the rate of change?
To make the answer look more complex
To make the calculation easier
To ensure clarity and accuracy in the context of the problem
To confuse the reader
3.
MULTIPLE CHOICE QUESTION
30 sec • 1 pt
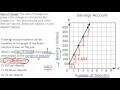
In the savings account example, what does a rate of change of $100 per deposit mean?
The balance decreases by $100 with each deposit
The balance increases by $50 with each deposit
The balance remains the same with each deposit
The balance increases by $100 with each deposit
4.
MULTIPLE CHOICE QUESTION
30 sec • 1 pt
What is the first step in finding the rate of change from a graph?
Calculate the total change in x
Calculate the total change in y
Find the slope of the line
Identify two points on the graph
5.
MULTIPLE CHOICE QUESTION
30 sec • 1 pt
What is the significance of the word 'per' in the context of rate of change?
It indicates subtraction
It indicates multiplication
It indicates division
It indicates addition
6.
MULTIPLE CHOICE QUESTION
30 sec • 1 pt
In the complex example, why is it suggested to pick whole number values on the graph?
To make the calculation more difficult
To ensure the graph is accurate
To avoid dealing with decimals
To make the graph look neater
7.
MULTIPLE CHOICE QUESTION
30 sec • 1 pt
What does a rate of change of 2/25 represent in the context of the gas volume and temperature example?
The volume decreases by 2 units for every 25 units of temperature increase
The volume increases by 2 units for every 25 units of temperature increase
The temperature decreases by 2 units for every 25 units of volume increase
The volume remains constant
Access all questions and much more by creating a free account
Create resources
Host any resource
Get auto-graded reports
Continue with Google

Continue with Email
Continue with Classlink
Continue with Clever
or continue with
Microsoft
%20(1).png)
Apple
Others
Already have an account?
