Line of Best Fit Concepts
Interactive Video
•
Mathematics, Biology, Science
•
9th - 10th Grade
•
Practice Problem
•
Hard

Thomas White
FREE Resource
Read more
10 questions
Show all answers
1.
MULTIPLE CHOICE QUESTION
30 sec • 1 pt
What is the primary goal of creating an equation for a line of best fit?
To simplify the dataset
To eliminate outliers from the dataset
To make the data look more organized
To predict future data points
2.
MULTIPLE CHOICE QUESTION
30 sec • 1 pt
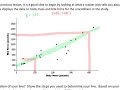
In the crocodilian dataset, what trend is observed between body mass and bite force?
As body mass increases, bite force remains constant
As body mass increases, bite force increases
As body mass increases, bite force decreases
There is no observable trend
3.
MULTIPLE CHOICE QUESTION
30 sec • 1 pt
What is the strategy for drawing a line of best fit on a scatter plot?
Connect the first and last data points
Draw a line that avoids all outliers
Draw a line that is as close to as many points as possible
Draw a line that passes through the origin
4.
MULTIPLE CHOICE QUESTION
30 sec • 1 pt
Why was Soul's line of best fit considered inaccurate?
It was too short
It was drawn through the origin
It overestimated and underestimated many predictions
It perfectly matched all data points
5.
MULTIPLE CHOICE QUESTION
30 sec • 1 pt
What makes Patty's line of best fit a good choice for predictions?
It starts at the origin
It avoids all data points
It is the longest line
It is as close to as many points as possible
6.
MULTIPLE CHOICE QUESTION
30 sec • 1 pt
What are the two key components needed to write the equation of a line of best fit?
Slope and y-intercept
X-axis and y-axis
Data points and outliers
Mean and median
7.
MULTIPLE CHOICE QUESTION
30 sec • 1 pt
How do you determine the slope of a line of best fit?
By finding the average of all data points
By dividing the change in y by the change in x between two points
By counting the number of data points
By measuring the length of the line
Access all questions and much more by creating a free account
Create resources
Host any resource
Get auto-graded reports
Continue with Google

Continue with Email
Continue with Microsoft
or continue with

%20(1).png)
Apple
Others
Already have an account?
