Box Plots and Line Plots - Dapat dicetak Box-plots Worksheets Year 10 - Quizizz
Box Plots and Line Plots

15 T

6th - Uni

Box Plots - Dapat dicetak Box-plots Worksheets Year 10 - Quizizz
Box Plots

13 T

10th

Probability, Box Plots, Scatter - Dapat dicetak Box-plots Worksheets Year 10 - Quizizz
Probability, Box Plots, Scatter

11 T

8th - Uni

Dot Plots, Box Plots, and Histograms - Dapat dicetak Box-plots Worksheets Year 10 - Quizizz
Dot Plots, Box Plots, and Histograms

38 T

9th - 12th

Box Plots - Dapat dicetak Box-plots Worksheets Year 10 - Quizizz
Box Plots

8 T

8th - 10th

Histograms and Box Plots (ghs) - Dapat dicetak Box-plots Worksheets Year 10 - Quizizz
Histograms and Box Plots (ghs)

16 T

8th - 12th

Box Plots and Dot Plots - Dapat dicetak Box-plots Worksheets Year 10 - Quizizz
Box Plots and Dot Plots

27 T

9th - 12th

Reading & Interpreting Box Plots - Dapat dicetak Box-plots Worksheets Year 10 - Quizizz
Reading & Interpreting Box Plots

12 T

9th - 12th

Statistical Questions and Box Plots - Dapat dicetak Box-plots Worksheets Year 10 - Quizizz
Statistical Questions and Box Plots

13 T

6th - Uni

Dot Plots, Histograms, and Box Plots - Dapat dicetak Box-plots Worksheets Year 10 - Quizizz
Dot Plots, Histograms, and Box Plots

50 T

7th - 12th

Statistics: Dot, Box, and Stem-and-Leaf Plots - Dapat dicetak Box-plots Worksheets Year 10 - Quizizz
Statistics: Dot, Box, and Stem-and-Leaf Plots

14 T

9th - 12th

Box Plots Homework - Dapat dicetak Box-plots Worksheets Year 10 - Quizizz
Box Plots Homework

13 T

7th - 12th

Understanding Box Plots - Dapat dicetak Box-plots Worksheets Year 10 - Quizizz
Understanding Box Plots

11 T

6th - 10th

Understanding Box Plots - Dapat dicetak Box-plots Worksheets Year 10 - Quizizz
Understanding Box Plots

11 T

6th - 10th

Q20: Histograms, Box Plots, Dot Plots - Dapat dicetak Box-plots Worksheets Year 10 - Quizizz
Q20: Histograms, Box Plots, Dot Plots

6 T

9th - 12th

Cumulative Frequency and Box Plots - Dapat dicetak Box-plots Worksheets Year 10 - Quizizz
Cumulative Frequency and Box Plots

10 T

7th - 12th

Understanding Dot Plots, Box Plots, and Histograms - Dapat dicetak Box-plots Worksheets Year 10 - Quizizz
Understanding Dot Plots, Box Plots, and Histograms

11 T

6th - 10th

Box Plots and Data Plots - Dapat dicetak Box-plots Worksheets Year 10 - Quizizz
Box Plots and Data Plots

20 T

7th - Uni

Samples and Populations Box and Whisker - Dapat dicetak Box-plots Worksheets Year 10 - Quizizz
Samples and Populations Box and Whisker

20 T

7th - Uni

Box and Whisker Quick Review - Dapat dicetak Box-plots Worksheets Year 10 - Quizizz
Box and Whisker Quick Review

13 T

9th - 12th

Line and Box Plots - Dapat dicetak Box-plots Worksheets Year 10 - Quizizz
Line and Box Plots

20 T

6th - Uni

Comparative Inferences with Box Plots - Dapat dicetak Box-plots Worksheets Year 10 - Quizizz
Comparative Inferences with Box Plots

17 T

6th - Uni

Understanding Dot Plots, Histograms, and Box Plots - Dapat dicetak Box-plots Worksheets Year 10 - Quizizz
Understanding Dot Plots, Histograms, and Box Plots

11 T

6th - 10th

Skewness - Dapat dicetak Box-plots Worksheets Year 10 - Quizizz
Skewness

10 T

8th - 10th

Explore printable Box Plots worksheets for Year 10

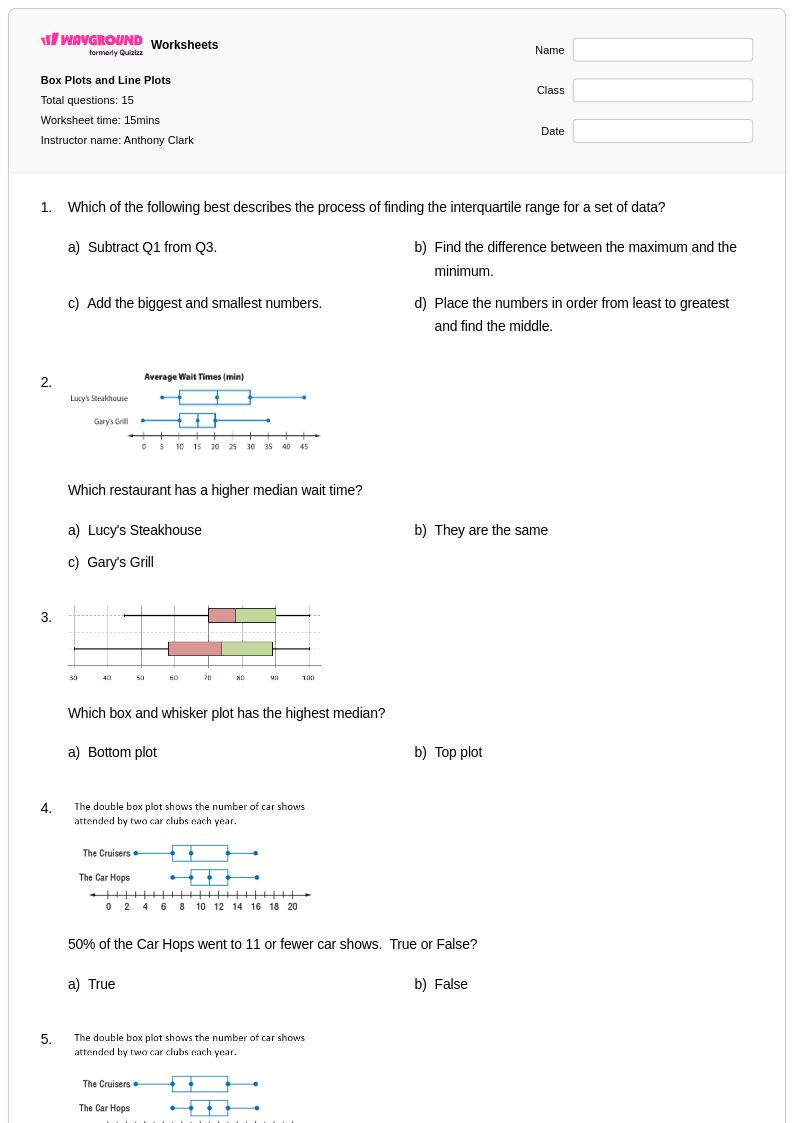
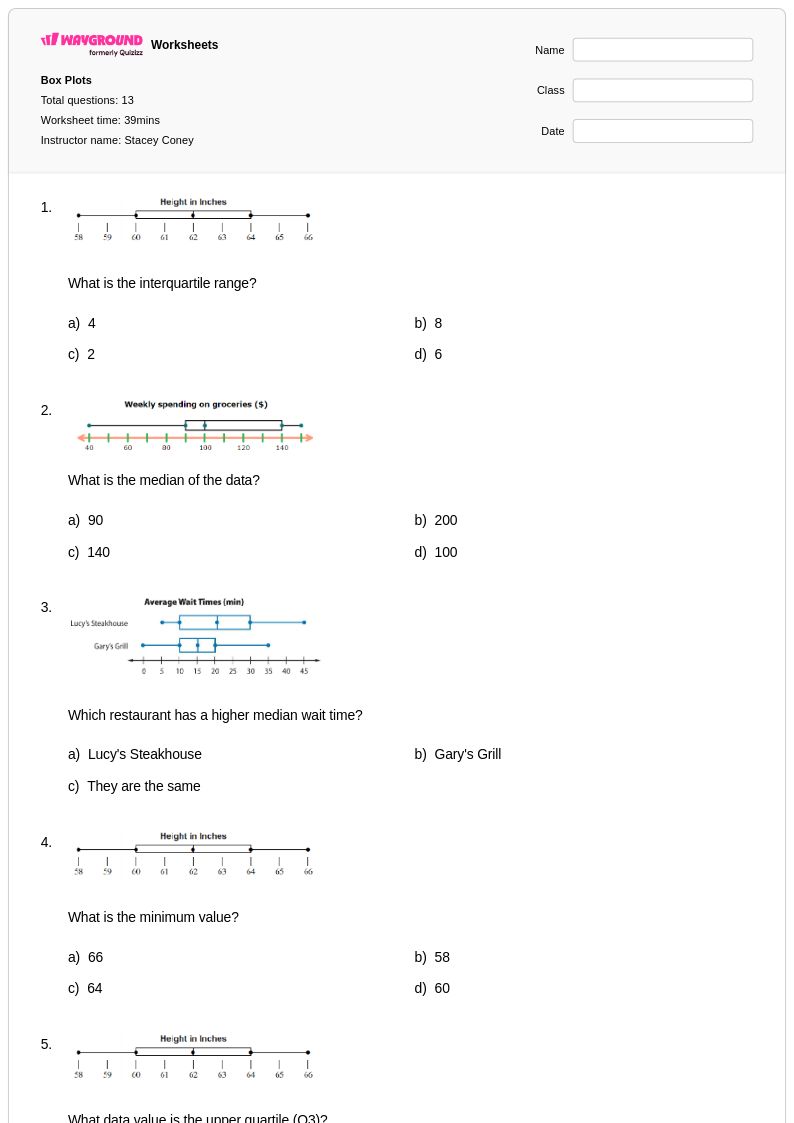
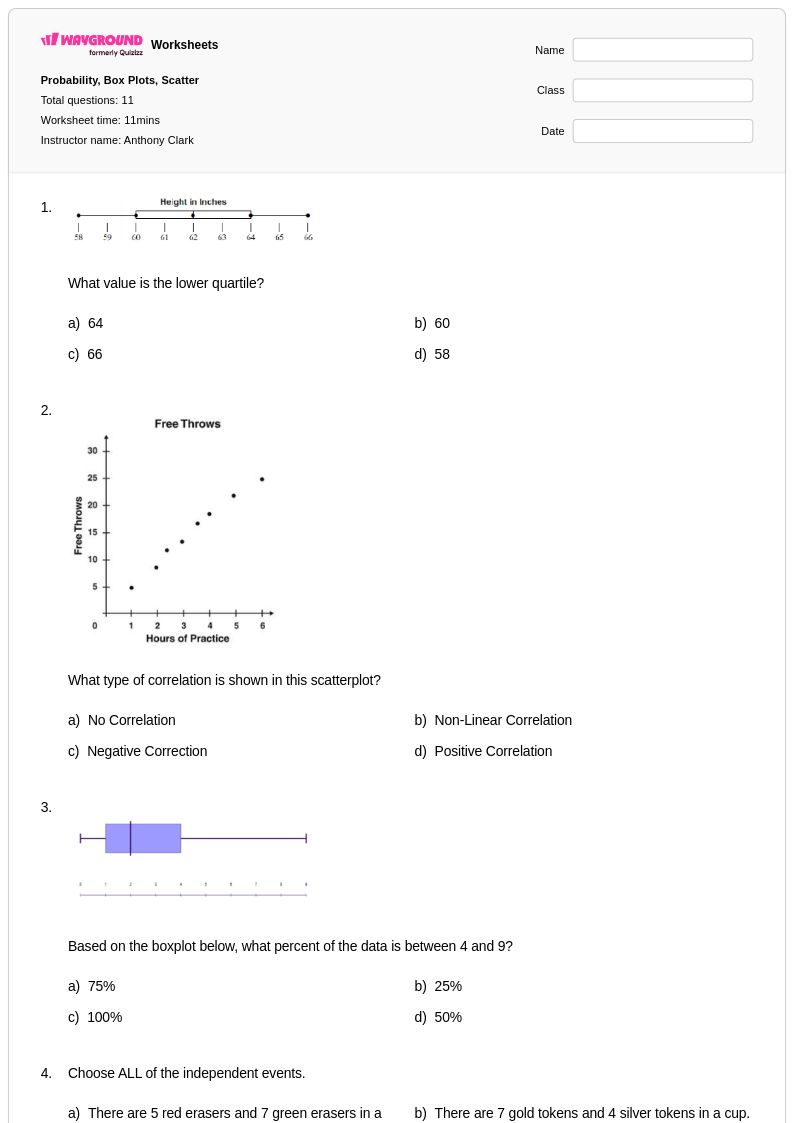
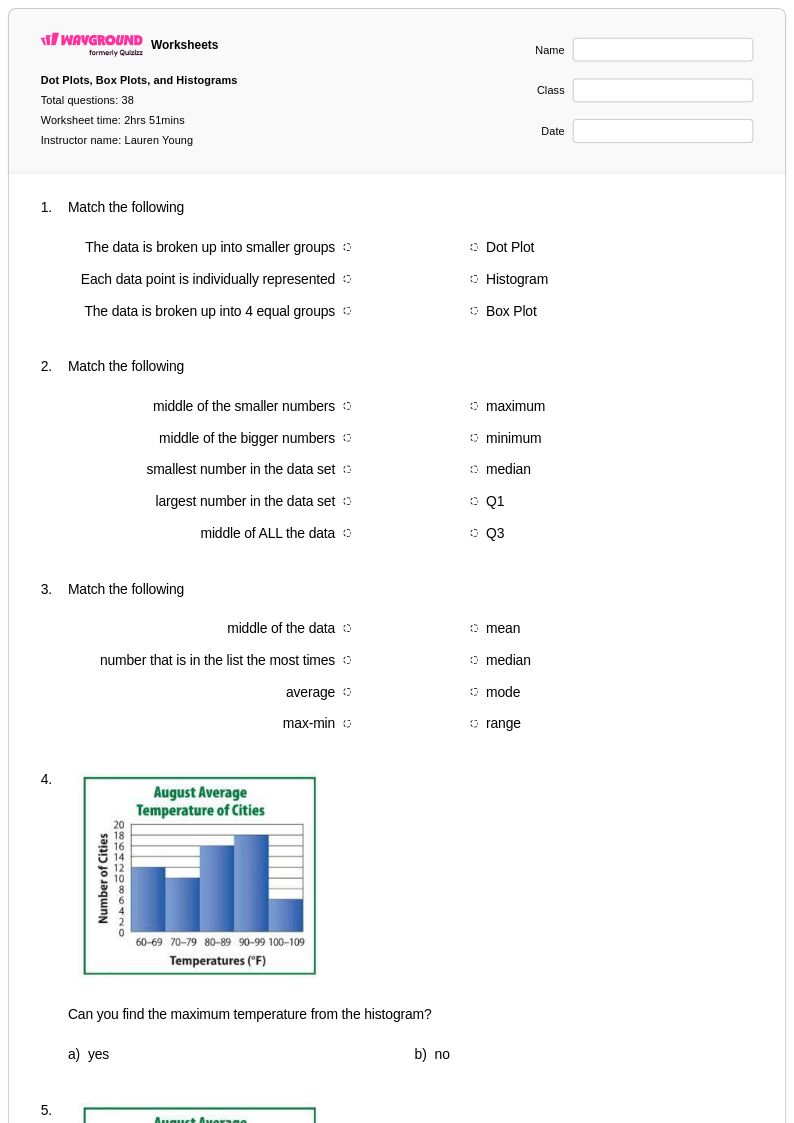
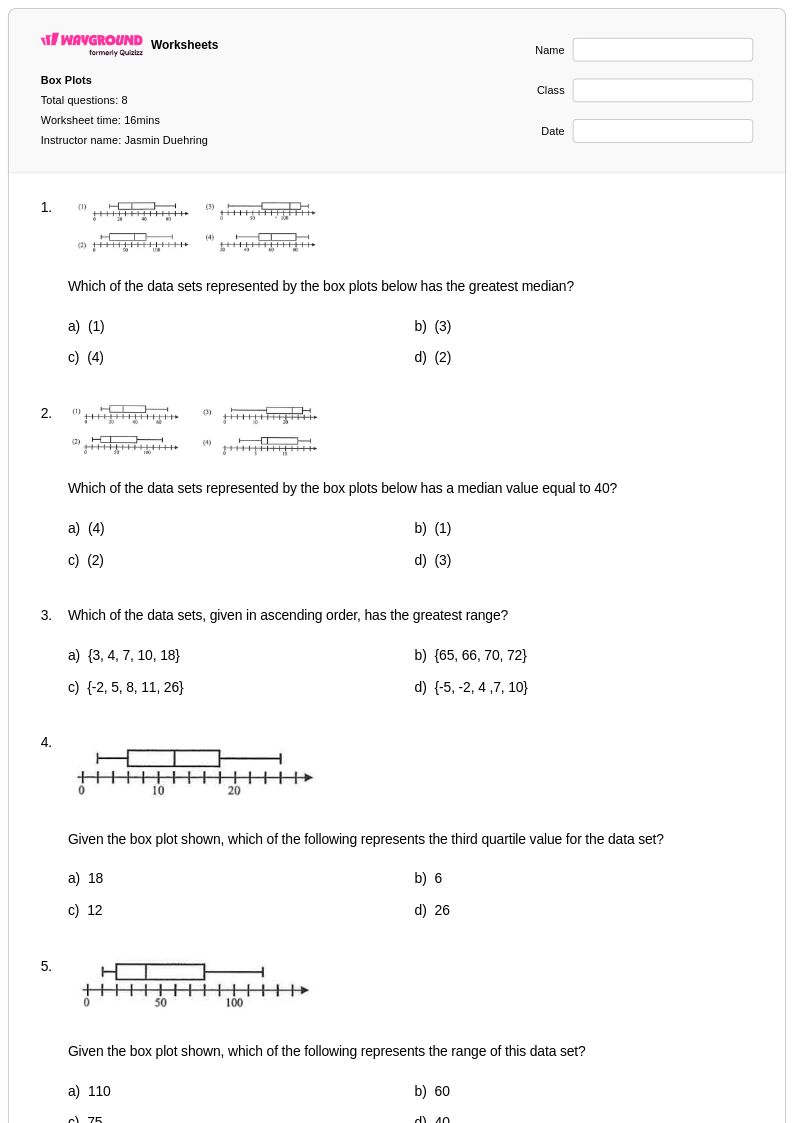
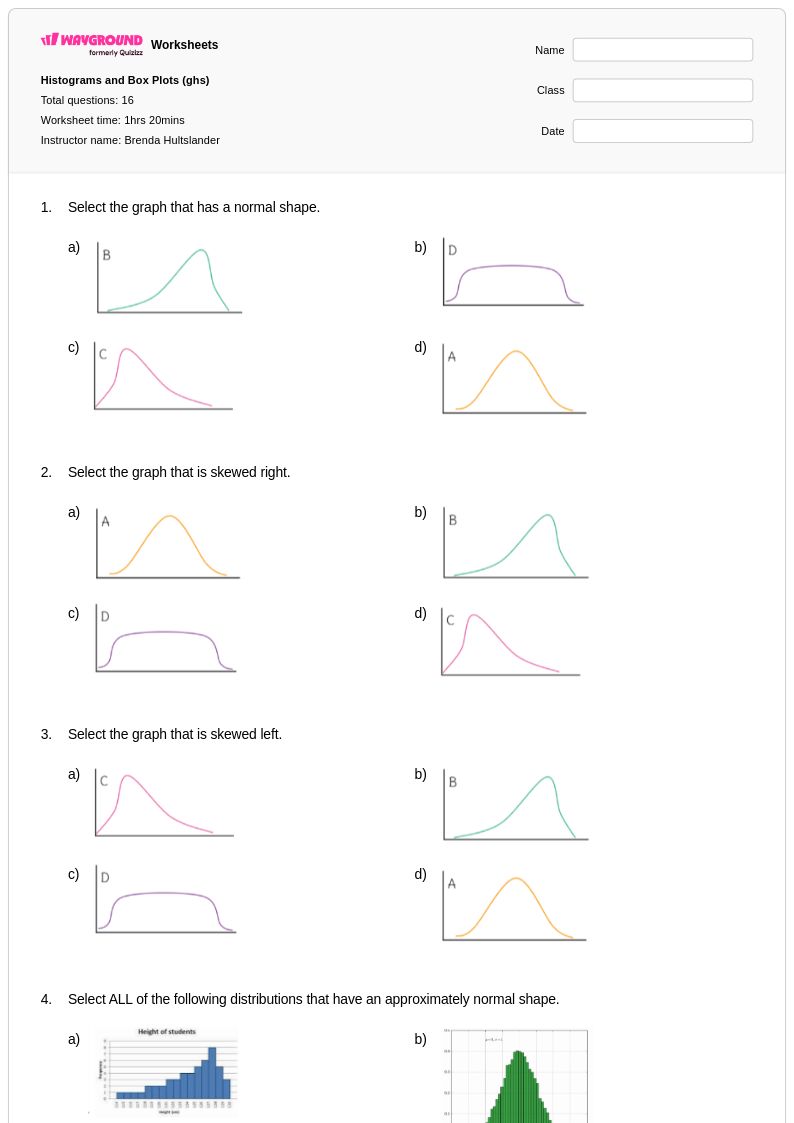
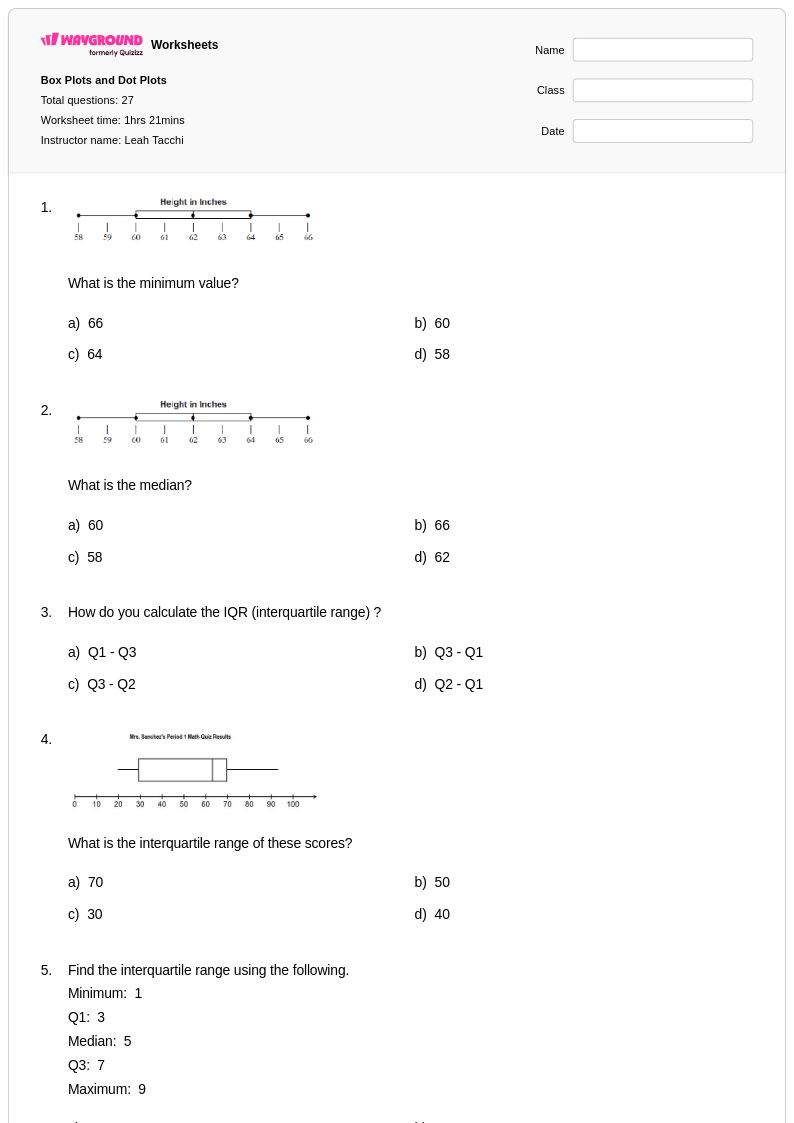
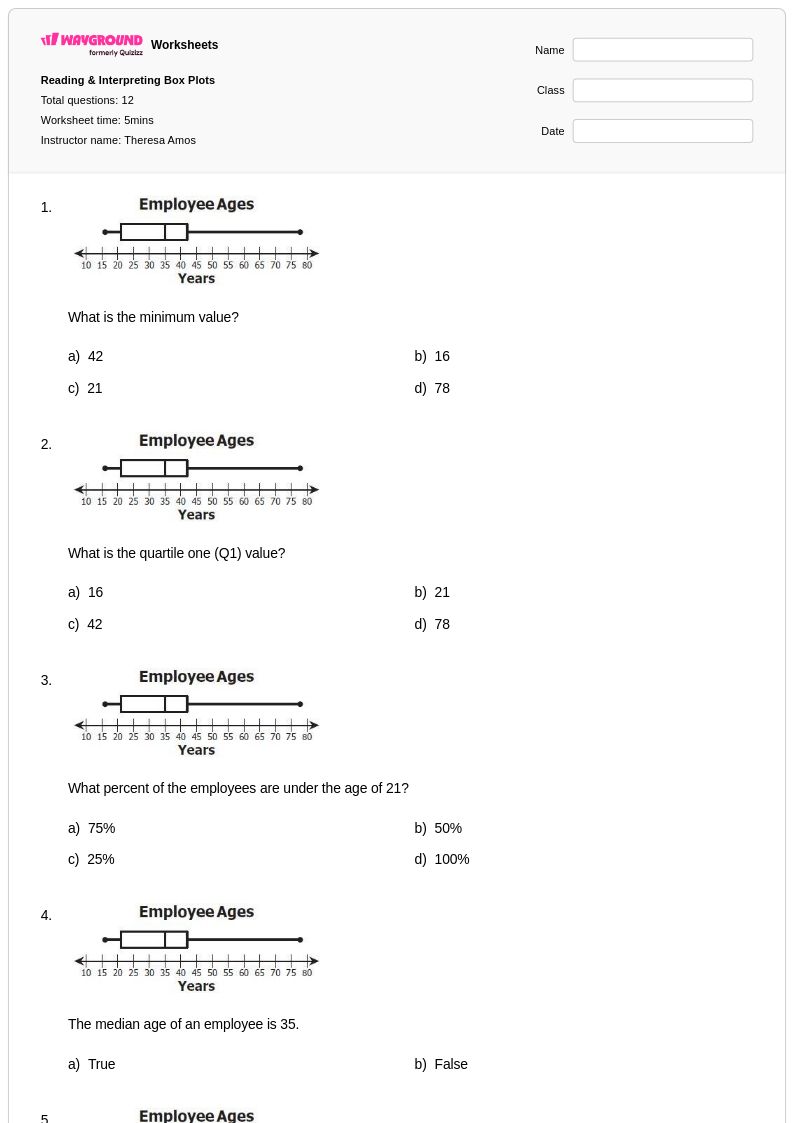
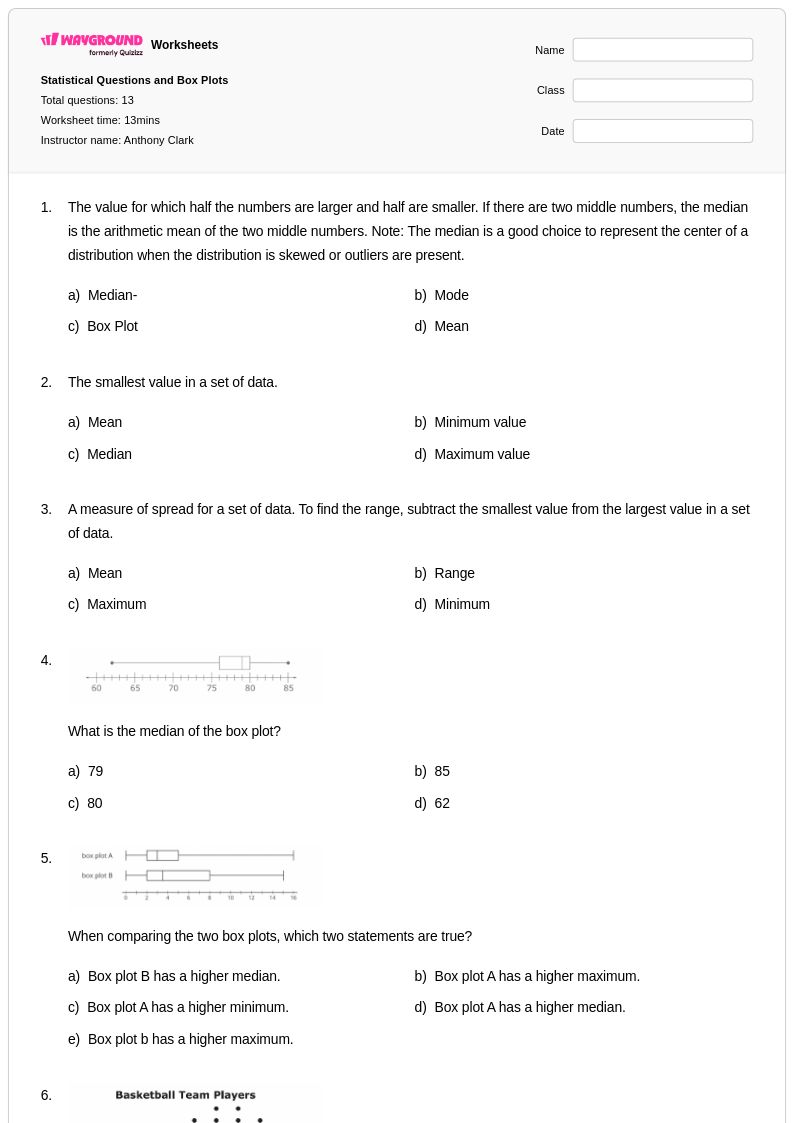
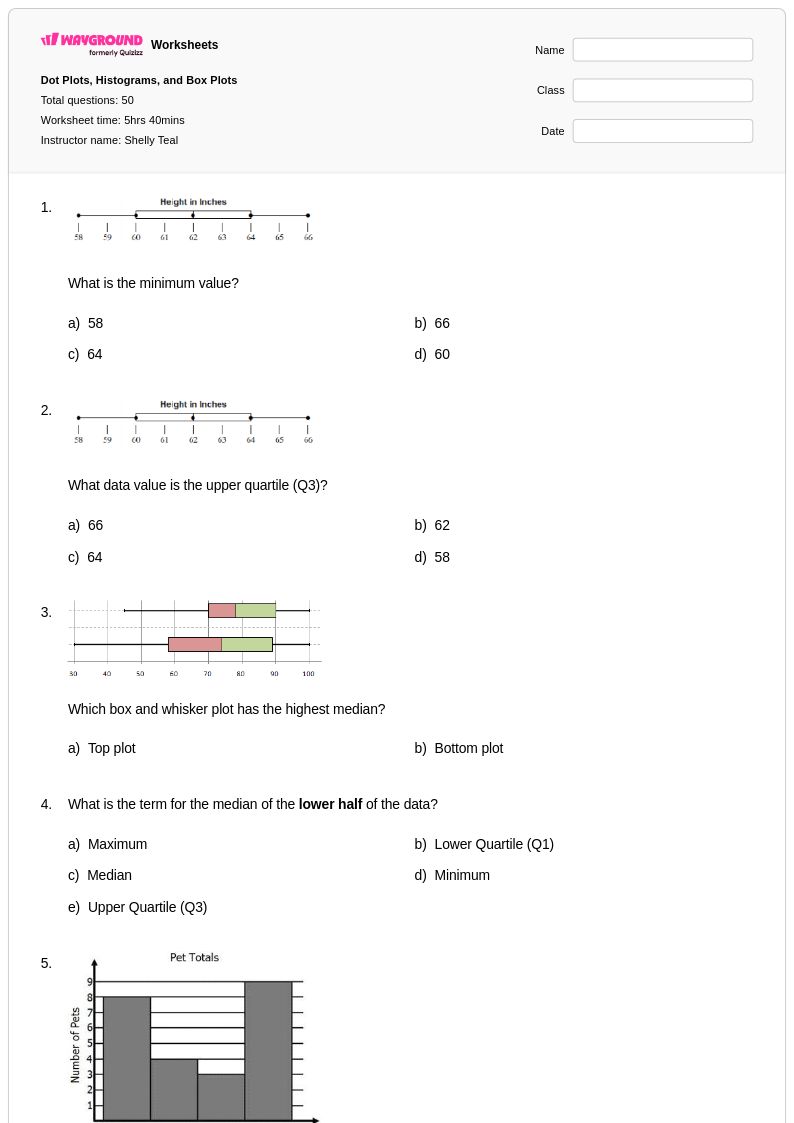
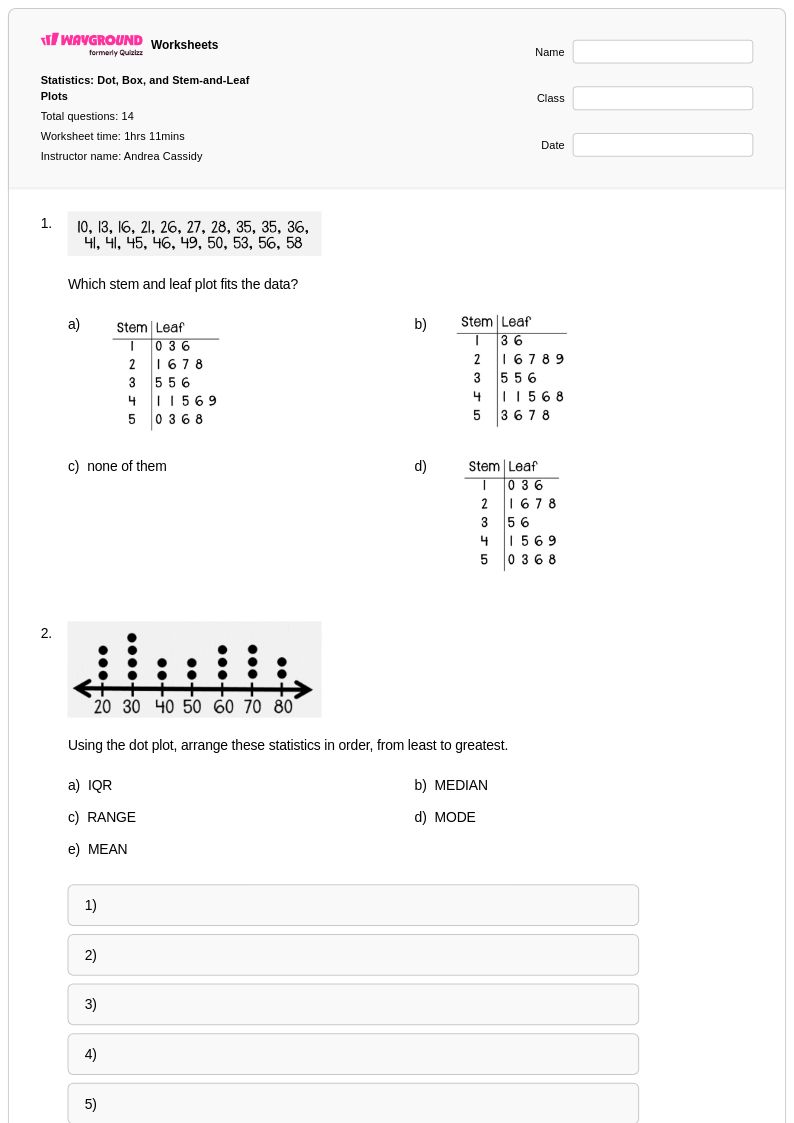
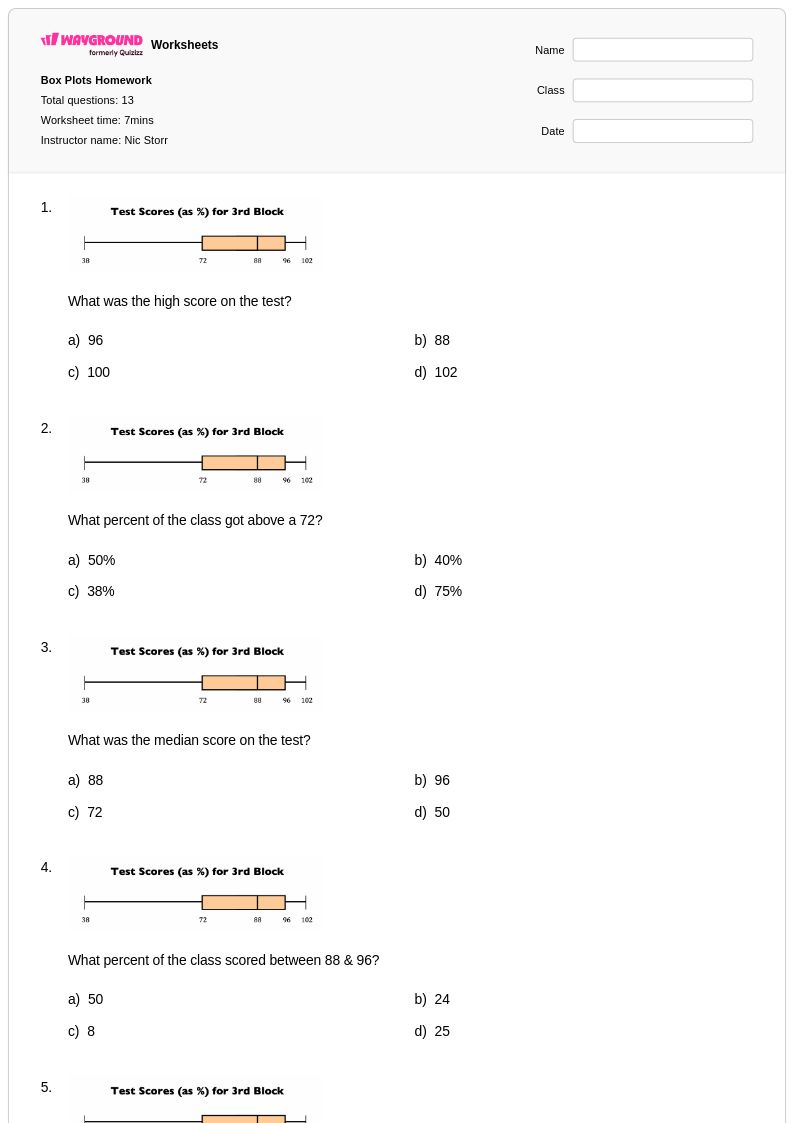
Box plots serve as a fundamental statistical visualization tool for Year 10 students, helping them understand data distribution, quartiles, and outliers in meaningful ways. Wayground's comprehensive collection of box plot worksheets provides students with structured practice problems that build essential skills in reading, interpreting, and constructing these critical data displays. These free printable resources focus on key concepts including identifying the five-number summary, comparing multiple data sets, and recognizing the significance of median, quartile ranges, and potential outliers within various contexts. Each worksheet includes a detailed answer key that supports independent learning and allows students to verify their understanding of box plot construction and analysis techniques.

Wayground, formerly Quizizz, empowers educators with millions of teacher-created box plot resources that streamline lesson planning and enhance student engagement with data visualization concepts. The platform's robust search and filtering capabilities allow teachers to quickly locate materials aligned with specific curriculum standards and learning objectives, while differentiation tools enable customization for diverse learning needs and skill levels. These versatile worksheet collections are available in both printable pdf format and interactive digital versions, making them ideal for classroom instruction, homework assignments, remediation sessions, and enrichment activities. Teachers can seamlessly modify existing resources or combine multiple worksheets to create comprehensive practice sets that reinforce statistical reasoning and prepare Year 10 students for advanced data analysis concepts.